$ES #es-mini futures #trading setup #Elliott Wave #weekend update #weekly
Part II of the Weekend Update.
Let’s start from a macro view. I keep watching two very differnet macro paths:
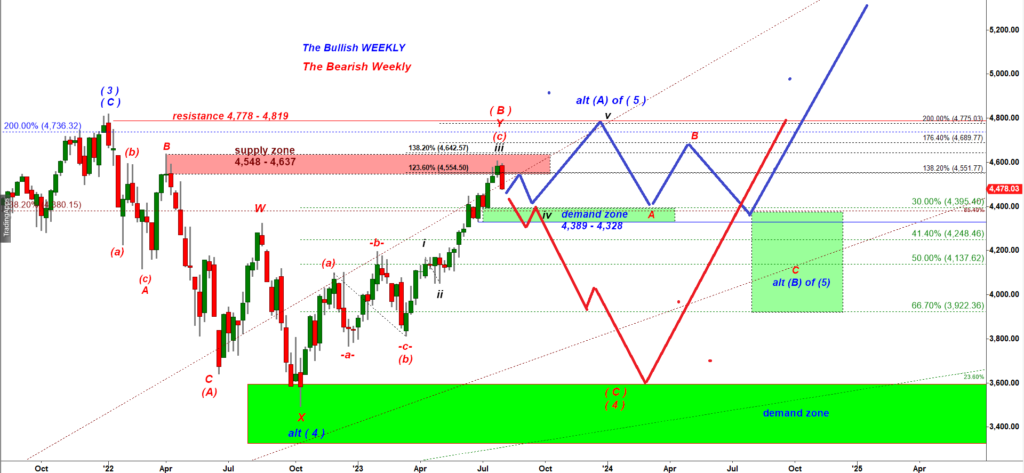
Under the blue bullish path an a-b-c move down to that green demand zone would be stopped by bulls and we would get another large move down targeting the Jan 2022 high.
Under the red bearish path price would most likely drops down in a straight line fashion, violate 4,328 support and then after a brief consolidation would continue going down in a strong decline of a subwave (C) of wave (4) down targeting 3,600.
The main idea is that I expect price to test 4,400 main support in either of those two scenarios, the bullish and the bearish.
If we get an a-b-c move down to that Strong Demand Zone that would be a great buying opportunity.
In contrast, if we get a strong impulsive looking drop down to that area and ES-mini undercuts briefly 4,369 that drop would most likely confirm ES made a major top and started a large move down in the red wave (C) of (4) down shown above.
Let’s switch to a daily chart. Note that green 50 MA Daily at 4,406:
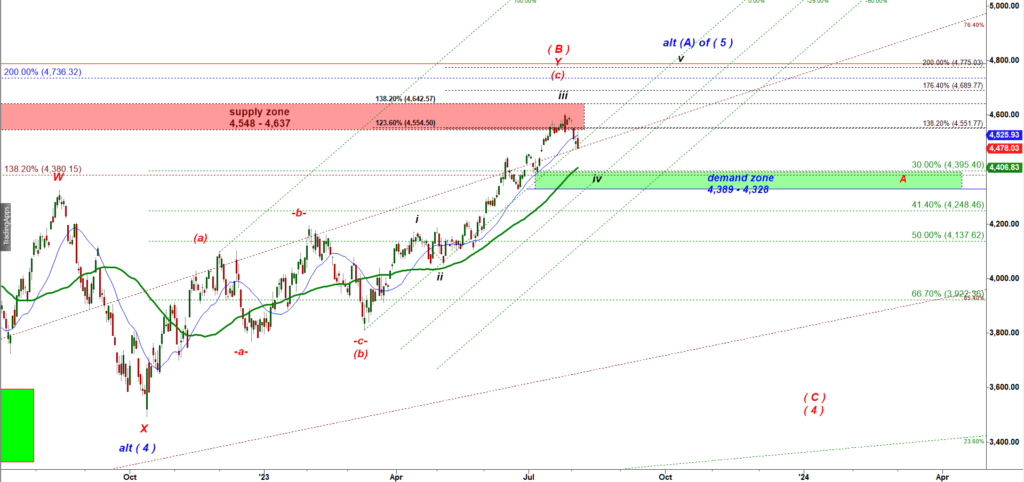
That 50 MA daily has a steep upward slope. We can be sure, bulls will step in to defend that widely watched moving average.
Now let’s look at the Daily chart of ES-mini:
First of all note, the whole move up off the October 2022 low has a clean three wave up move. Here you can learn why three wave moves normally are considered corrective (read my blog post “Impulsive vs Corrective Waves” here).
That three wave structure of a bounce is the main argument behind the bearish red path shown on the weekly chart of S&P 500 shown above.
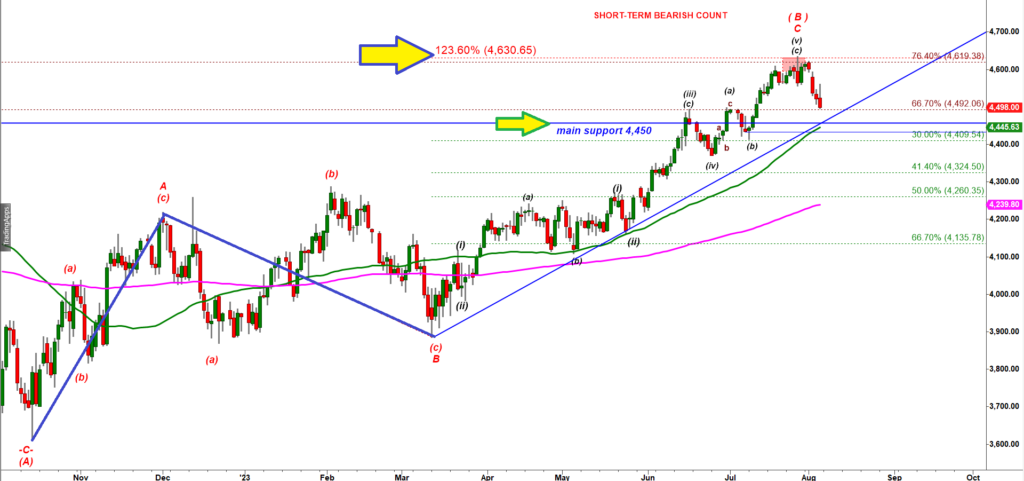
Let’s get back to the daily chart of ES-mini. Note the green 50 Day Moving Average that stands at 4,445.
Again, 50 DMA is a widely watched moving average. The crowd is trained to buy a pullback to the upward sloped 50 Day MA. Note that I drew the blue horizontal line at 4,450. The wave (iii) up topped at 4,493.75. When price comes back down to re-test the previously made highs it treats it as a strong support. But that does not men price will immediately pop off that same level where price used to make a temporary top. Normally bears would undershoot it. Imagine an inflated ball that is being pushed under the water. The deeper you push it under the surface the stronger it will jump out of the water over the surface level when you get tired of pushing it down.
Now let’s zoom in to my favorite macro timeframe 240 min chart:
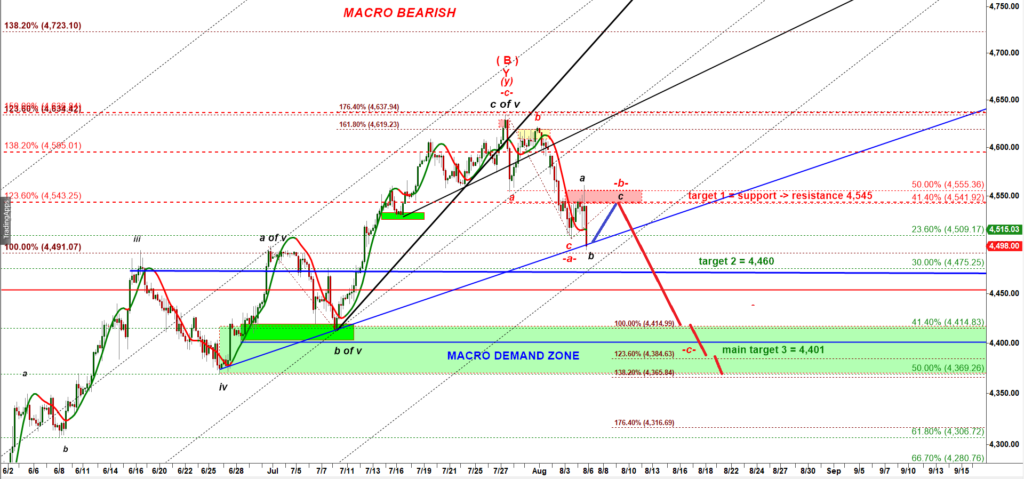
This path is a feasible scenario for the upcoming week and if we get a bounce up to  4,535 AND if that move up stalls right under the red box that would be a super sweet short setup for a quick deep dive down to 4,415 with likely extension down to 4,385 or even 4,370.
if we get that bounce up off the blue trend line and off the Monthly Support for August (4,405.75) but the bounce makes a lower high (in comparison to the high made at 4,560.75 on Friday) that would complete a corrective a-b-c up structure shaped as the Running Flat structure.
The Running Flat structure manifests weakness of bulls and strength of bears.
If the strong Friday afternoon drop was a corrective wave b down, imagine how strong will be an impulsive wave -c- down that would start after a bounce in a subwave c up (the blue line pointing to the Red Box).
Again, the Monthly Support for August is 4,505.75.
 For that scenario to get triggered we need bulls to reclaim that level 4,505.75 without letting bears to go under the Friday low made at 4,493.75.
Read the Part I of the Weekend Update “$ES: Will It Bounce Off The Fresh Monthly Support?”.