ES: Will This Bounce Stretch to 4,585?

  • CastAwayTrader
  • June 20, 2023
<<< Back to All Updates
<<< Macro Updates

$ES #ES-mini #trading setup #Elliott Wave

This is how a macro bearish wave count looks like for the cash index S&P 500:

SPX Daily. Bearish Macro

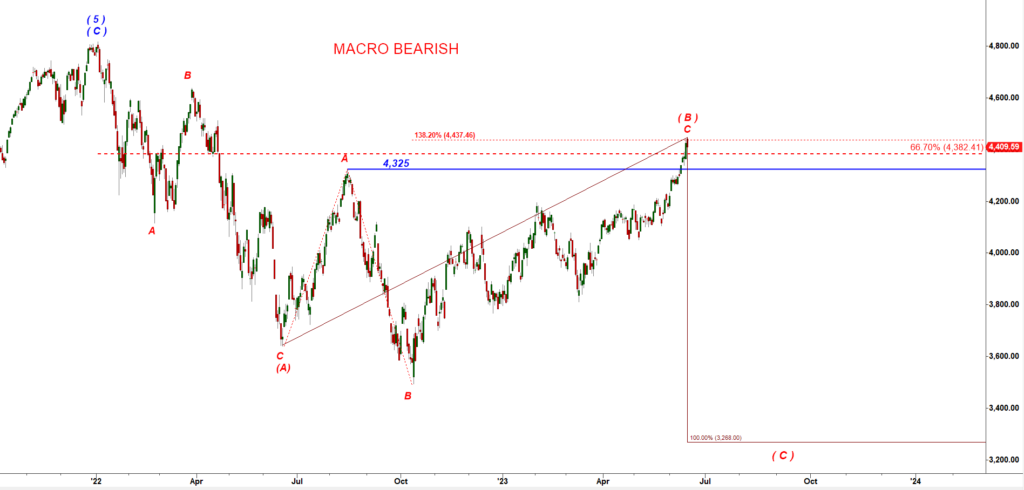
To trigger that bearish macro scenario bears need to push SPX back under the Aug 22 high = 4,325.

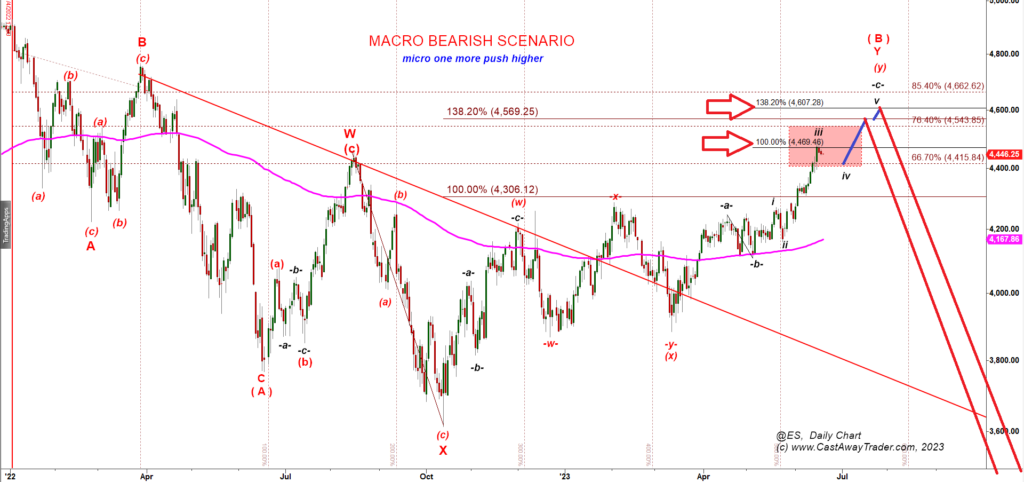
This is how the bearish macro scenario looks like for ES-mini futures:

ES-mini, 240 min chart, Macro bearish scenario

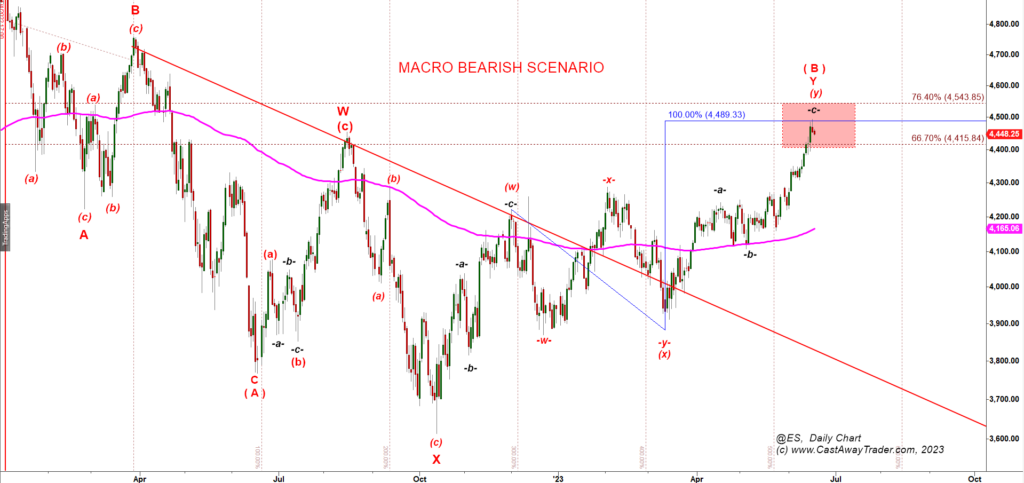
The problem for bears is that they failed to defend the critical resistance at 66.7% retracement fib = 4,378.25 (data for a continuous ES-mini contract from Tradingview). Bears really need to push ES back under 4,378.25 to revive that scenario and they have to do that quickly. The longer bulls hold ES over that level the higher probability is that that move is a much more than a bounce that temporary overshot the key resistance.

However, even after violation of the very important resistance at 66.7% retracement we still can consider this rally a corrective bounce.

Nasdaq composite index had a very similar structure in 2022:

Nasdaq Composite (COMPX) 120 min chart

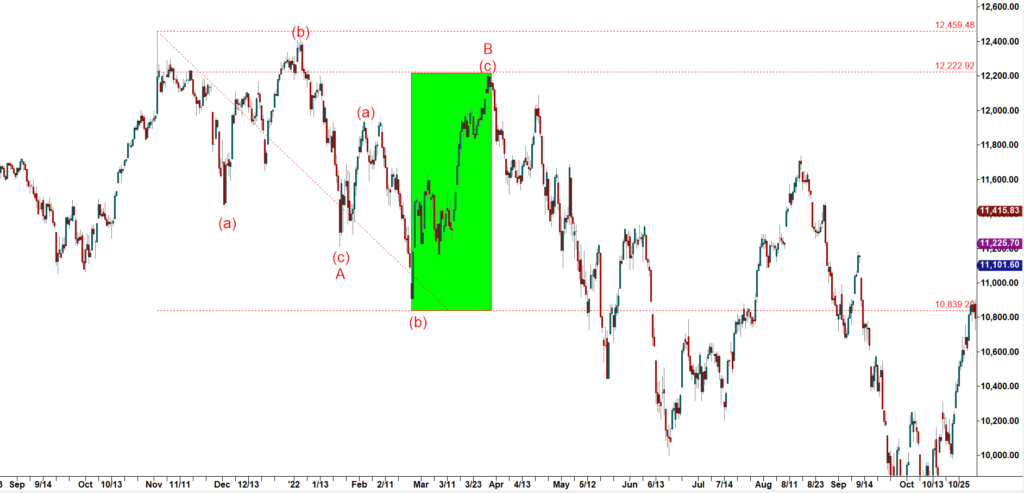
It made three pushes down and then started a crazy strong impulsive bounce retracing 85.4% of the preceding decline.

Let’s come back to the chart of ES-mini. My main problem with any bullish count off the Oct 2022 low is that we can not count the Oct low as a long time bottom:

ES-mini 240 min chart

To count a low as a major bottom and a completion point of a corrective structure we need to get either a two or a two wave decline. Instead we got three waves down that does not look like a completed corrective structure. In a similar structure Nasdaq composite played a short squeeze retracing 85.4% of the preceding decline off the Nov’21 high. If ES follows that path that rally may extend up to 4,622.75 retesting the March 22 high.

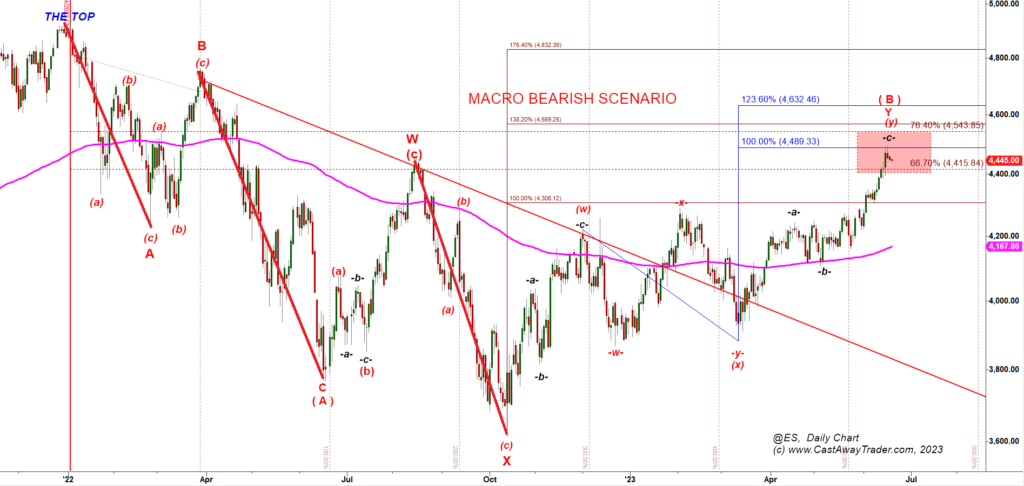
Below I show you a potential bullish path for extension of this bounce up to 4,600:

ES-mini 240 min chart, a bullish scenario

Lets come back again to Nasdaq Composite chart and focus of a micro structure of the March 2022 rally:

Nasdaq Composite (Daily), March 2022

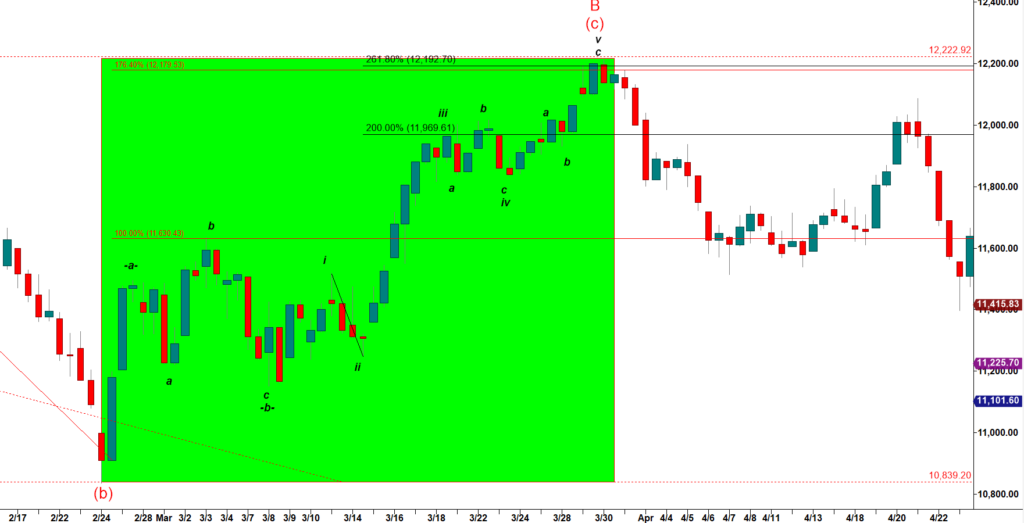
I would note three details of that fractal that we will later apply to this rally in ES-mini:

(i) a micro wave iii up topped at 200% ext of a micro wave i up, and

(ii) the wave iv down had a clean a-b-c micro structure but retraced only 20% of the wave iii up, a very shallow pullback that had a clean a-b-c structure, and

(iii) the final wave v up topped at 261.8% ext of a micro wave i up.

Now lets look at the structure of the rally in ES-mini futures:

ES-mini Daily chart

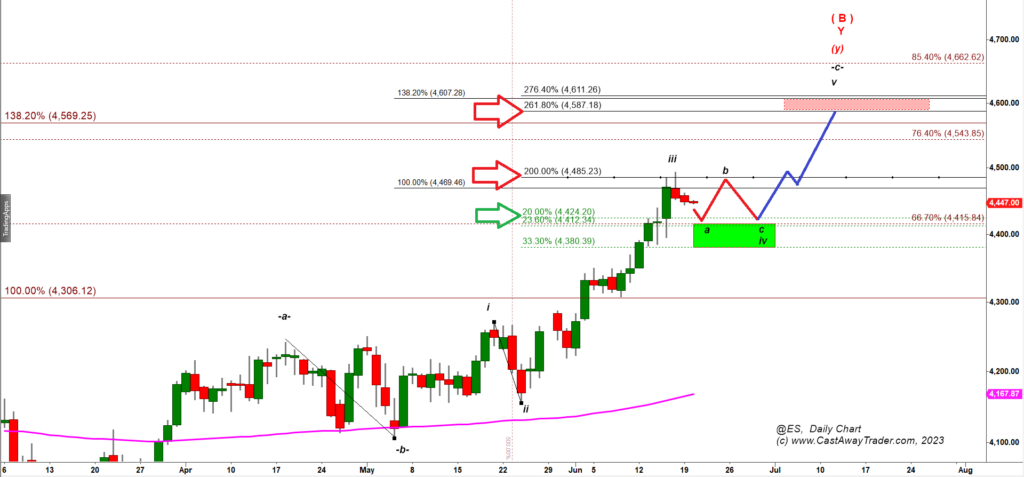
So far the rally in ES-mini stopped at the very same 200% ext of its micro wave i up.

If it keeps following that fractal, then we are going to get a reversal at 4,124 (a 20% retracement fib applied to the rally in a micro wave iii up).

Under that fractal played by Nasdaq composite in March 2022, upon completion of a flat a down, b up, c down consolidation over 4,110 bulls may push ES up to 4,587.

In conclusion:

  • in theory bears have chance to trigger a very bearish reversal pattern but to do that they have to keep pushing down and trigger a failed breakout setup by pushing under 4,378.
  • if, in contrast, we get a very shallow flat a-b-c consolidation over 4,400 that would most likely set the stage for another 180 point rally in a micro wave v up.
  • As you can see, I still do not have a purely bullish count that would allow bulls to push ES to new all time high.
  • At this moment I only consider a possibility for extension of that corrective bounce. Upon completion of the bounce we should expect a strong decline to make lower lows.

Subscribe to Free Updates

Get Unlimited Access

PrevPreviousES / SPX: I Would Not Buy It Until It Pulls Back
NextES: Testing the Green BoxNext

More To Explore

$ES: Leaking Down to a 80 Day Trough As Expected

$ES #ES-mini #Elliott Wave Today the US stock market is closed. Let’s review the overnight decline in ES-mini futures. ES

CastAwayTrader June 19, 2025

$ES: This Consolidation Builds a Base for Another Rally

$ES #ES-mini #triangle ES continues to consolidate in a narrow range squeezed in between of two contracting trend lines: ES-mini

CastAwayTrader June 18, 2025

Important Disclaimer

CastAway Trader LLC, the publisher of this web-site and videos is not registered as an investment adviser nor a broker/dealer with either the U. S. Securities & Exchange Commission or any state securities regulatory authority. Users of the website www.castawaytrader.com and viewers of the videos are advised that all information presented on the website is solely for informational purposes, is not intended to be used as a personalized investment recommendation, and is not attuned to any specific portfolio or to any user’s particular investment needs or objectives.

Trading stocks, options, or futures carries a high level of risk, and may not be suitable for all investors. Before deciding to trade, you should carefully consider your objectives, financial situation, needs and level of experience. CastAway Trader LLC provides general overview of trading methods that does not take into account your objectives, financial situation or needs. The content of this website must not be construed as personal advice. All trading setups and/or trades presented in the web site and/or trading chat room by CastAway Trader an/or by other members of the chat should be considered hypothetical for educational purposes only and should not be expected to be replicated in a live trading account.

An investor could potentially lose all or more than the initial investment. You should not speculate with capital that you cannot afford to lose. Only risk capital should be used for trading and only those with sufficient risk capital should consider trading. Risk capital is money that can be lost without jeopardizing ones’ financial security or life style.

You should be aware of all the risks associated with trading. You should seek advice from an independent financial advisor.

Any information posted on this web site is not to be construed as an offer to sell or the solicitation of an offer to buy, nor is it to be construed as a recommendation to buy, hold or sell (short or otherwise) any security. All users of the website must determine for themselves what specific investments to make or not make and are urged to consult with their own independent financial advisors with respect to any investment decision. The reader bears responsibility for his/her own investment research and decisions, should seek the advice of a qualified securities professional before making any investment, and investigate and fully understand any and all risks before investing. All opinions, analyses and information posted on the website are based on sources believed to be reliable and written in good faith, but should be independently verified, and no representation or warranty of any kind, express or implied, is made, including but not limited to any representation or warranty concerning accuracy, completeness, correctness, timeliness or appropriateness. In addition, CastAwayTrader LLC and its officers and employees undertake no responsibility to notify such opinions, analyses or information or to keep such opinions, analyses or information current. Also be aware that the owners, officers and employees of the web site www.castawaytrader.com may have long or short positions in securities that may be discussed on the website, Premium Trading Chat room and/or in the videos posted by CastAway Trader LLC.

Past results are not indicative of future profits.

Subscribe to Free Updates

Get Unlimited Access