$ES #Macro
In addition to our primary bearish scenario we have to consider two alternative mid term bullish counts:

Note the red declining red trend line. Bulls pushed price to yet another lower high and stopped under the resistance.
Let’s look at the Daily chart of ES-mini futures:

Here we see the very same declining red trend line. The whole market is watching that line now. Ideally bulls will fail at this resistance again and we get another swing down according our bearish scenario shown above.
However, last week bulls got a very strong argument in favor of more bullish scenarios. I came across a study that developed a very reliable “Thrust” indicator.
This is a white paper describing results of that study.
The main idea is that exceptionally strong Advance-Decline numbers and Up/Down volume numbers have predictive power for a long term bullish follow through.

After that specific signal S&P has been higher in 83% cases over 63 days.
I coded that indicator to check it by myself. The bullish thrust signal got triggred indeed on Friday:

Let’s check below how that signal played out in the past:

In June 2020 we got a three week pullback but then the market started to rally strongly. That type of a signal catches an extraordinary strong breadth in terms of a 5 day average Advance/Decline ratio. Over the span of five consecutive days more than 77% of stocks have to advance.
Therefore, that signal pinpoints a bullish exhaustion that is supposed to be followed by a breather. The questions are how deep that breather would be and what would normally happen after such a pullback.
In June 2020 the pullback was pretty shallow an was followed by a very extended rally.

Another bullish “Thrust” signal fired off on Jan 10, 2019.
Back then the market was recovering after a sharp sell off and we did not get any pullback after that signal. What I found amazing is that the price was well under 200 MA (the purple line) but nevertheless kept climbing higher after that exhaustive spike in bulls sentiment.

We got two thrust signals in 2015 and 2016 and both signals were followed by very small pullbacks only. Again, both signals fired off when price was UNDER 200 MA and the 200 MA was sloped downward. And nevertheless price managed to slice through 200 MA without any problem!
Note that in all the cases, price kept pushing higher for weeks or months with breadth being unable to reach the extreme high level associated with the initial thrust that ignited those rallies!
Notice that we do not get those signals often!

We got two more “thrust” signals in 2012. In both cases we got only minor pullbacks. Both signals were followed by big rallies.
However, that indicator is not the Holy Grail in a sense that it fails from time to time as any other good indicator:

In 2011 it failed miserably. That exhaustion signal was followed by a huge five wave down decline.
But in 2010 it did rather well:

It produced two bad signals in 2008:

Finally, it did exceptionally well in 1997:

The May 1997 signal was followed by a three month long unstoppable rally. Those are all the signals since 1993 (all the data available in TradingView).
So we got 13 long term buy signals with only three failures.
That indicator has been a pretty accurate predictor of big rallies…
Let’s come back to where we are now:

At this point bulls remain to be in control. The whole market expects that red trend line around 4,045 to get tested.
Part 2. Daily and Weekly Overbought conditions.
Subscribers of my Premium chat room know that we are going to get a Daily overbought signal if S&P/SPY opens with a higher high on Tuesday:

Quite often four consecutive higher highs on a Daily, Weekly or Monthly charts are followed by a pullback.
A higher high made on Tuesday will be the forth consecutive higher high on daily.
A higher high made on Tuesday will be the third consecutive higher high on weekly.
My proprietary MTF Cycle Trader indicator for TradingView available for subscription has already fired a Daily Overbought signal at Friday close:

Another higher high made on Tuesday morning would produce a “Very Overbought” Daily signal.
This is how those signals fared off in Oct – Nov 2022:

Quite often overbought signals do not nail the exact top but predict a nice tradeable pullback. When the market gets overbought that means it went too far and too fast. But at the same time overbought conditions mean that bullish momentum is very strong.
Cycle analysts expect the market to top in between Jan 13 and Jan 17th. According to them, the most important level of support is 3,992. If bears manage to push ES back under that level cycle work allows for bears to push the market back down first to the Monthly Resistance and potentially even lower, to the Monthly Support.
Part 3. The Month Opening Range strategy review.
I want to remind you about the Month Opening Range Strategy. I shared several lessons explaining that strategy with subscribers of my Premium chat room. You can read about that strategy in my blog.

So far January 2023 has been a textbook case: A breakout of the Month Opening Range, followed by a retest of the broken Monthly resistance followed by a new rally in the direction of the breakout.


Note how Nov’22 rally got exhausted at mid month.
And then bears pushed price back down to that same Monthly Resistance.
In our current case the Monthly Resistance for ES-mini is located at 3,907.
Finally, let’s have a look at a micro picture.
On Friday morning I shared with expected path with subscribers of my Premium Chat room:
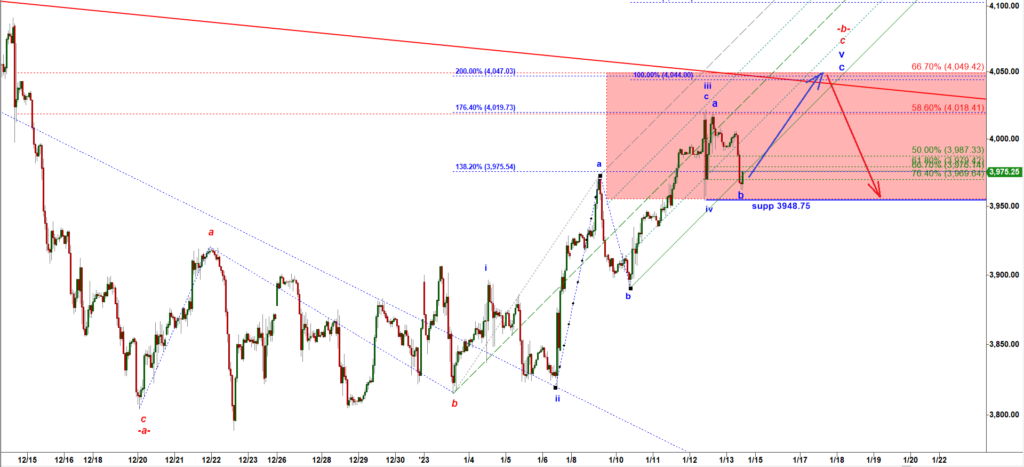
Since then ES-mini has been nicely following the first bullish part of that reversal/topping path:
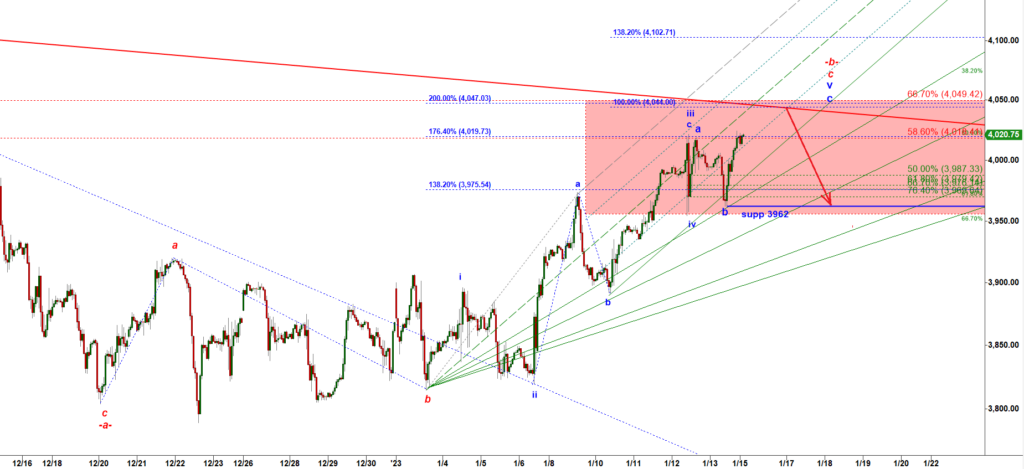
In conclusion: most likely ES-mini will extend higher and tag 4,045 – 4,050, the level where it will test the declining red trendline we discussed at the beginning of this report. I expect a bearish pullback off that level.
Bears should not have a problem to quickly push ES-mini back down to 3,960sh. And that is the main support for this market. Break under 3,962 would open the door for decline down to the Monthly Resistance at 3,907.
If bulls manage to stop decline at 3,860sh and then push ES back over 4,045 that would be a strong argument in favor of the bullish scenarios that allow bulls to accelerate the rally over 4,045 and push it to 4,400-4,600.