$RTY #Macro #Daily #W-X-Y correction #trading setup
On a daily chart of RTY-mini futures shown below you can see the whole (W) down, (X) up, (Y) down complex corrective structure that started at the top made in Nov 2021:

On that chart you can clearly see a repeating cycle (see vertical lines).
That cycle started at the Nov’21 top.
Then it nailed the late Dec 2021 top.
Then it nailed the Feb 22 top.
Then it nailed the March 30, 2022 top.
Then it nailed the May 2022 bottom.
Then it nailed June 28 top.
Then it nailed August 12 top.
Then it nailed Sep 28 bottom.
Then it nailed Nov 15 top.
And this same cycle points either to a top or a bottom this week.
Interesting that these days we have 360 degrees/days since the Dec’21 top = a full Gann’s cycle.
On a 240 min chart below you can see that RTY has been consolidating in a micro wave -iv- up for more than a week:
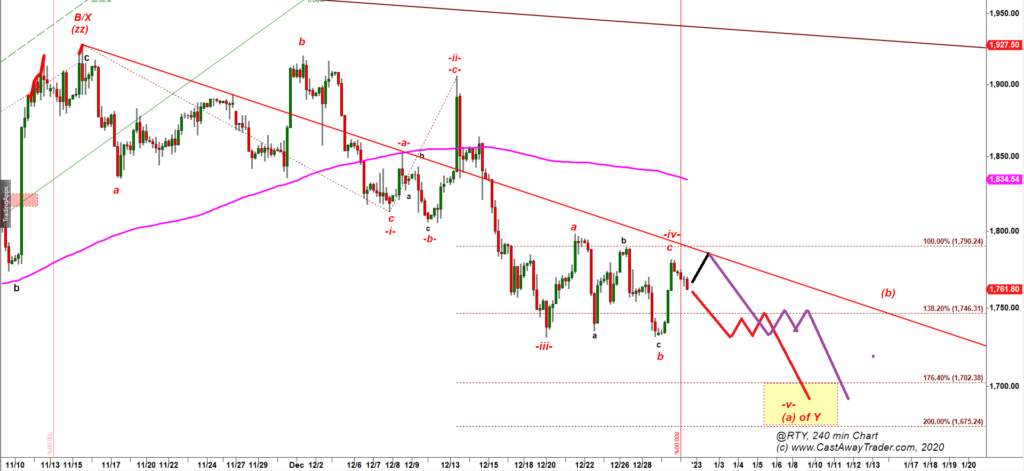
Most likely that corrective wave -iv- up has topped and the wave -v- down has started. The target for the wave -v- of (a) is the Double Bottom made by RTY in June and September 2022.
We can not exclude one more attempt of bulls to push higher to test 1,790 – 1,800 resistance of the down trend line shown on the chart above. But I expect the next big move to be down.