The Weekend Update
Let’s review two alternative Macro Counts based on Daily charts of ES-mini futures.
(1) We will start from the Straightforward Bearish “3-3-5” scenario:

We can count the corrective action that started in Jan’22 as a larger simple textbook (A) down, (B) up, (C) down wave count.

Any corrective structure is composed of two big moves (two legs or waves labelled A and C ) interconnected by a pullback in wave B up. The first leg in wave (A) down bottomed in May’22. Then we got a complex (a)-(b)-(c) up structure in wave (B) up that topped in mid Aug’22. Upon completion of the corrective wave (B) up a new decline in wave (C) down started.
There are two reasons why we could NOT count that second leg down in wave (C) down off the mid August high completed:
(i) Under that straightforward count the second leg down in wave (C) shall be composed of five micro waves. We got only three waves down, and
(ii) Its highly unusual when wave (C) finds a long term bottom at 76.4% ext of wave (A) down (see the black arrow on the Daily chart of ES-mini posted above).
In the vast majority of cases that 76.4% ext works as a strong support and produces a big bounce but price then comes back down to stretch lower and test 100%, 123.6% or 138.2% ext of wave (A) down (see green arrows on the daily chart of ES-mini).
The simplest way to count that overlapping wild A up, B down, C up zig-zag is to consider it as a corrective wave 4 up to be followed by another decline in wave 5 down targeting a new lower low (see green arrows for targets).
Let’s zoom-in to see the micro structure behind that October consolidation:

In any A-B-C up structure, the second leg up in subwave C normally has a clean impulsive structure. In contrast, in that case, the structure of the move highlighted with the yellow box looks ugly and lacks any impulsive structure. Therefore lack of an impulsive structure behind that move up casts doubt over that bearish count.
So the Friday rally does not fit the bearish count well.
However, only this year we saw numerous cases when ES-mini would complete a textbook clean a-b-c up corrective structure, turns down, started a new leg down as expected, but then , surprisingly make another unnecessary rally re-testing the high made by wave c up. Let’s review three similar cases:

You can see two clean () up, (b) down, (c) up corrective structures highlighted with gray color. Both structures were followed by a push lower, exactly what you would expect after completion of a flat corrective structure.
But look what happened next, some weird strong short covering rally that sometimes so strong so it can make a new higher high:

Let me show you another example of a completely identical pattern:

That was a textbook clean (a)-(b)-(c) up structure that was followed by an orderly turn down followed by a new move down.
Look what happened next:

… price turned up again and we got some weird strong short covering rally that almost retested the previously made high. And only after that unnecessary rally an overdue leg down finally started.
Let’s come back again to the current 60 min chart of ES-mini:

Here we see a similar clean corrective looking (a) up, (b) down, (c) up structure that was followed by an orderly turn down followed by a new move down. But then we got that rally on Friday…
Let’s make two conclusions from review of the Simple bearish “3-5-5” count:
(i) That rally did not invalidate that bearish count, and
(ii) if bulls manage to push ES slightly over the previous high 3,777.25 but then they drop the ball and bears manage to push ES back under that level we will get yet another reliable short “failed breakout” setup:

(2) Now let’s review an alternative macro count that allows bulls to produce a corrective rally into the year end:

I noted that the move down off the mid-Aug’22 was structured as a three wave move. This is why that move down could be a part of the second leg down off the mid Aug high.
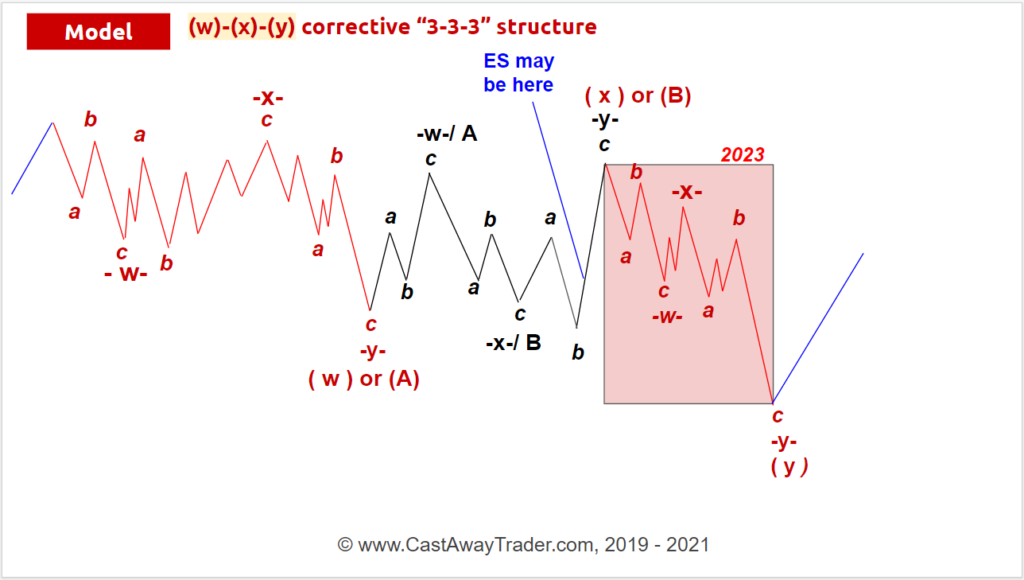
The structure of the decline off the Jan’22 top is composed of three large waves. To complete that structure we need to get a full A down, B up, C down structure off the mid August high.
Under that count ES might have started subwave (c) of wave B up.
Under that count a move up in wave B up into the year end would be followed by another strong decline in wave C of (Y) down next year. That final drop would most likely be the strongest one, the climatic flush.
Let’s zoom-in to see a micro count behind that short term bullish “Santa’s rally” count (the bear market rally scenario):

That specific wave count and its slight variation (will be posted below ) look like feasible scenarios. Those two bullish scenarios are well aligned with traditional bullish sentiment of October – November.
That scenario argues for a five wave up rally off the low made at 3,502 on Oct 13th. That five wave up rally would complete a subwave C in a corrective A up, B down, C up structure and set the stage for the final drop lower in 2023:

And below I will show a slight variation of the micro bullish scenario:

The Friday rally looked like a textbook subwave (b) up, not like a start of wave (iii ) up. Under that micro count we can open higher and tag 3,800 on Sunday evening trading session. But then bears CAN push ES-MINI back under that 3,777 resistance and trigger a reliable short “failed breakout” setup. Then price would drop to 3,695 and that decline would complete a corrective (a) down, (b) up, (c) down micro structure of wave ( ii ) up and set the stage up for a big strong rally in wave (iii) up targeting 4,070.
That would be the easiest to trade and track scenario for the remaining months of 2022.
In conclusion:
- the Friday’s rally significantly increased probability of the Bullish scenarios; and
- 3,777 becomes a very important resistance for bulls, and
- bears have a good chance to push ES-mini back under 3,777 resistance to trigger a failed breakout setup; and
- if bulls fail to hold 3,777 resistance we will ,most likely see bears testing 3,700 – 3,695 support; and
- if bulls manage to stop the next decline at 3,695 we will get a super sweet long setup for a rally targeting 4,000+, and,
- finally, if bears stop the rally at 3,777 and then manage to push ES under 3,695 that would make the bearish count our primary scenario. That bearish scenario argues for another decline down to 3,350.