I traditionally update macro scenarios on weekends.
The main assumption of all three macro scenarios I will review before is that ES-mini made a lasting top in Jan’22 because it completed a five wave up rally that started in 2009.
Watch this video where I explain why: https://youtu.be/8zvNKipEpVM
Let’s start from a weekly chart showing a clean A-B-C down structure off the Jan’22 top:

According to the Harmonic Elliott Wave, the modified version of the Elliott Wave theory I practice, upon completion of an impulsive five wave up structure we always expect a corrective pullback that has either 3-3-5 structure of 3-3-3 structure:

This is a typical pattern behind a corrective “3-3-5” (A)-(B)-(C) down structure that follows a completed five wave up rally:

Below is the second most common repeating corrective pattern called the “3-3-3 structure” (also called the “Double Three”):

Those two most common corrective structures have the main difference in the way how the second leg down makes a new lower low.
At this point the most important hallmark of the “3-3-5” structure is a very strong decline in wave 3 of (C) down.
Wave 3 normally slices through all support levels and produce little pullbacks. Quite often it has gaps down that do not get filled. Price just keeps going down non-stop not letting retail traders to catch any bullish bounce top go short. It leaves them behind. So far we did not see anything like that. We had a lot of directionless whipsaw and very strong bear market rallies.
Nevertheless let’s try to apply that 3-3-5 count to ES:

You can see A down, B up, C down move into July low. Those three waves are labelled as wave (A) down.
Then you can see a three wave bounce into mid August.
Those A up, B down. C up waves are labelled ( B ) up. Those another three waves from “3-3-5” down structure.
Remember, we call that structure “3-3-5” because it has three waves down, followed by three waves up, followed by the second leg down in wave (C) shaped as an impulsive five wave down structure.
According to that fractal (repeating pattern) ES may be completing subwave A of wave 3 down:

Below is a possible path under that VERY BEARISH SCENARIO:

I have two problems with that count/scenario:
1. Every wave analyst expects that upcoming strong drop but the market almost never follows the most expected scenario.
2. The move up labelled as “2” lacked an a-b-c subdivision and that is quite unusual for a wave 2.
Because of two problems I want to show you another scenario, a more complex than the first one described above. I slightly prefer that one over the other two:
MACRO BEARISH SCENARIO 2: “THE SECOND LEG DOWN SHAPED AS W-X-Y” or “3-3-3” complex structure:
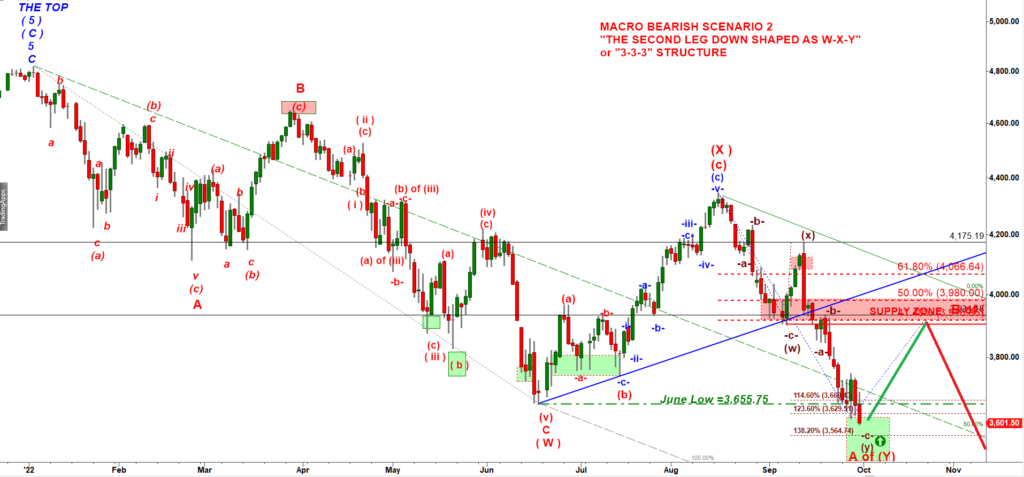
Under that scenario, the second leg down that started in mud August 2022 would be shaped as W down (three wave structure) X up (three wave structure) and, finally Y down (three wave structure).
Under that scenario ES is about to complete wave W, the first part of the second leg down:

This is a possible path down if ES follows that “3-3-3” structure:
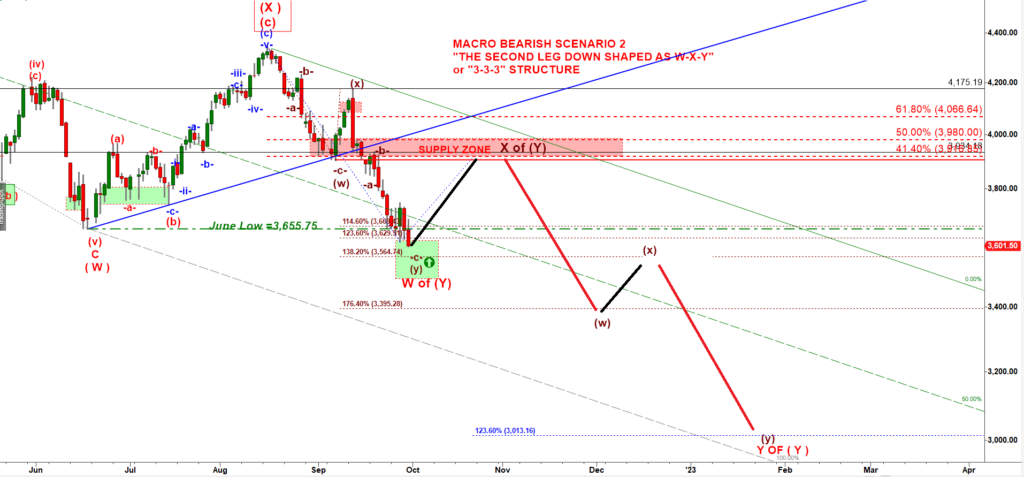
Those two setups are very very similar. They both argue for a decline to 3,000 – 2,600 next year.
What is the main difference?
Under the first VERY BEARISH “3-3-5” structure the upcoming bounce in subwave B up of wave 3 down should (1) be structured as (a) up, (b) down, (c) up structure and (2) be quite shallow retracing 30% – 41.4% of the preceding drop.
In the vast majority of cases, subwave B up of wave 3 down is shaped as a flat consolidation looking like an a-b-c zig-zag. That is more a correction through time rather than through price. That means that price keeps bouncing in a relatively narrow range, consolidating before bears realize that bulls are dead and its safe to start the next strongest leg down in subwave C of wave 3 down.
Under the scenario 2, complex 3-3-3 structure, the upcoming bounce would be a wave X up.
Always remember, A wave X up in a Double Three structure is
- a failed attempt of bulls to start a new rally, and
- A wave X up is driven by a short squeeze, forced liquidation of short positions, and
- normally lacks any structure, quite often that looks like a pullback less run away rally.
It may retrace 50% of the preceding decline in a strong rally and then suddenly bulls get exhausted and bears start a new (a) down, (b) up, (c) down decline in wave Y.
Finally, I have a lower probability least expected and most painful Macro scenario 3:
Scenario 3. VERY BULLISH:

Under the Bullish Scenario 3 the top in mid August was not the top of wave ( B ) up but only its first part, subwave A up.
Then this (w)-(x)-(y) down structure off the md August top is subwave B down of wave ( B ) up (see the labels on the fractal above).

Under that lower probability yet a feasible VERY BULLISH count we can get a five wave up rally in subwave C of wave (B) up targeting 4,080 – 4,150 into Christmas (you can call it the Santa’s rally scenario). That setup is feasible as well, there is nothing really exotic in that setup. The prevailing sentiment is super bearish and nobody expects that rally. And this is why it may materialize. In addition, the seasonality turns bullish starting the second week of October. And if you look at seasonality of S&P in the second mid-term year of a new dem president this is what normally happens in the 4th quarter.
In conclusion, we have three very different macro scenarios but all of them argue for an upcoming bullish pullback which fits normally bullish seasonality for October month.
The only question is how big will that pullback be.
Nobody knows the right answer. Even the market does not know.
We will be watching a micro structure of moves trying to match those structures to any of those three macro scenarios.
Now let’s talk micro. Let’s look at 120 min chart below:
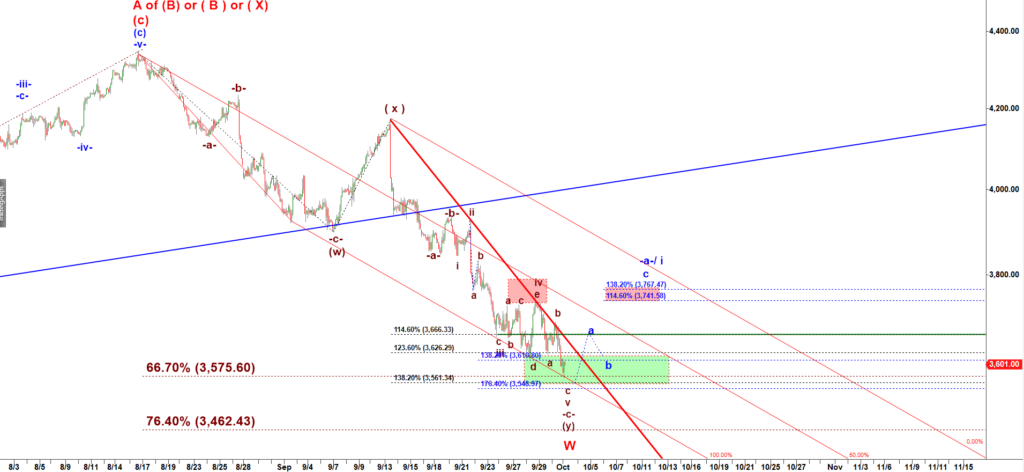
On Sunday night ES-mini dropped into the Green Target box and tagged the ideal target at 3,575. This is where the whole move down off the August 2022 high may bottom. This is where a move up may start.