Last week my primary scenario was a bullish wave count that considered a 4.5 month long consolidation as a flat wave (iv) down:
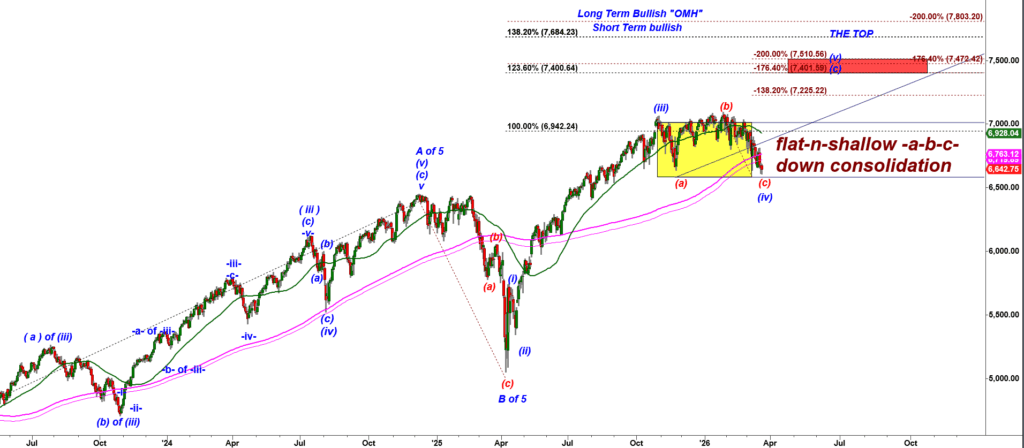
ES-mini Daily chart
I think that scenario is still very well alive.
Let me show you a micro count of the Feb – Mar 2026 decline:
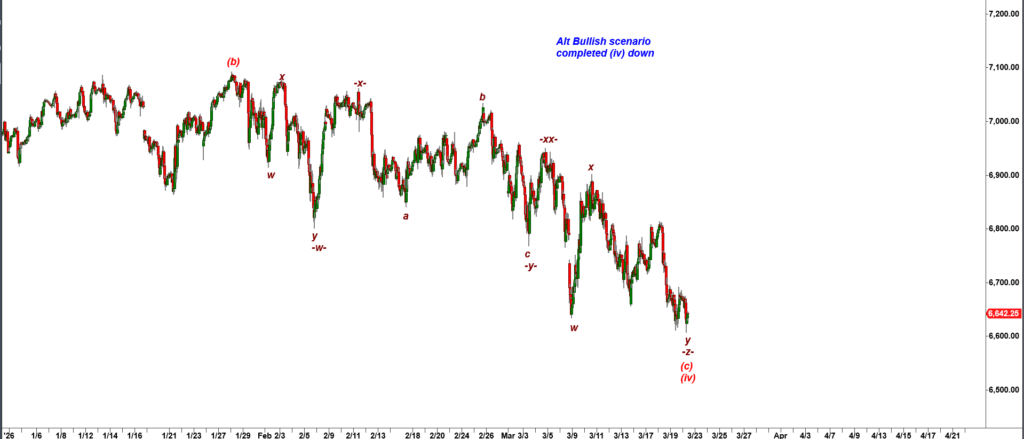
ES-mini 60 min chart
First we can see a wild overlapping structure. Every move down made only a marginal progress and then we would get a very deep bullish pullback retracing substantial part of the preceding drop.
That is a sign of a corrective action, a temporary pause allowing bulls to accumulate before they start another leg up.
we can micro count that Feb-Mar 2026 decline as a completed Triple Three corrective structure.
This is how I explained that pattern in my video course:
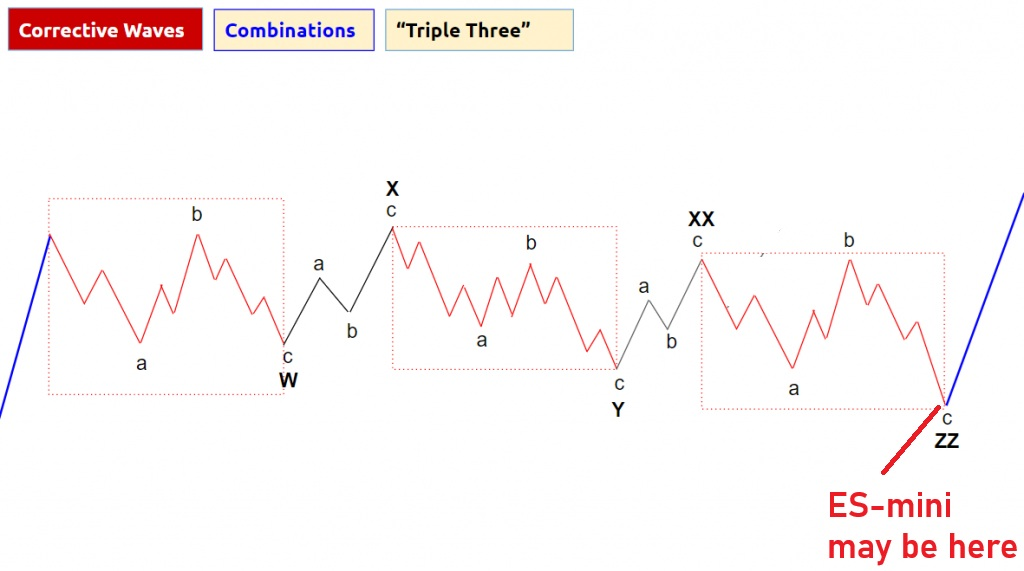
… As you can see on the chart above , that “Triple Three” pattern is comprised of three a-b-c structured connected by two wave sin direction of the main trend labelled as X and XX. The ultimate goal of that structure is to change bullish sentiment of the crowd. That final a-b-c down may not make significantly lower lows. It may reach only nominally new lows. It’s goal not to scare bulls with a heartbreaking decline but rather keep burning time making bulls to lose hope in continuation of the trend up. And another goal is to bring back conviction to bears. They need to believe the rally finally stopped and we have seen a major bearish reversal. The market waits for bears to increase shorts because those shorts will become fuel of another rally in wave ( C ) of ( 5 ) targeting new higher highs.”
I would say we can consider that bullish Triple Three scenario as long as bulls hold ES OVER the Yearly S1 support = 6,592.75:
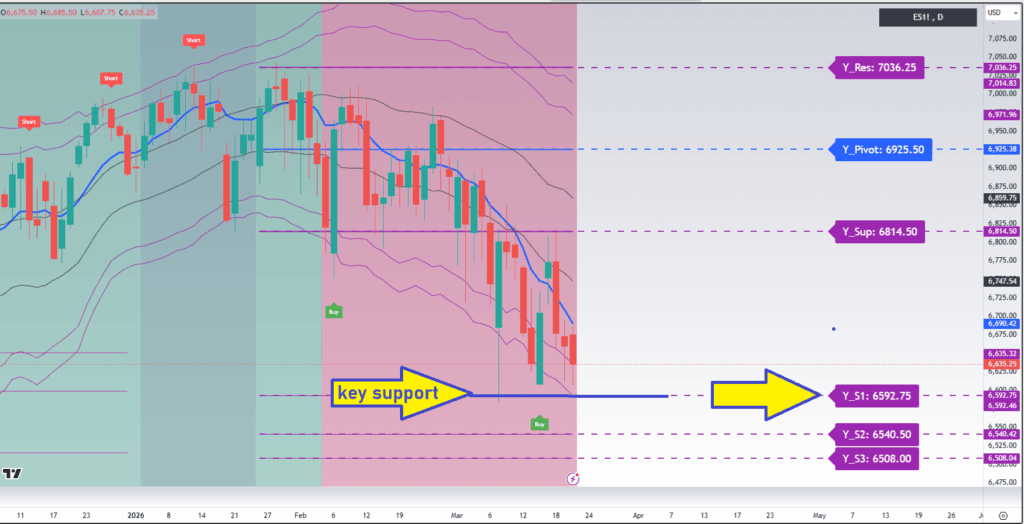
The levels are calculated by my new Opening Range MTF indicator for TradingView.
Break under that level would open the door for the bearish alternative.
We have had that long term bullish | short term bearish scenario for several months
See the “Running Flat” scenario below:
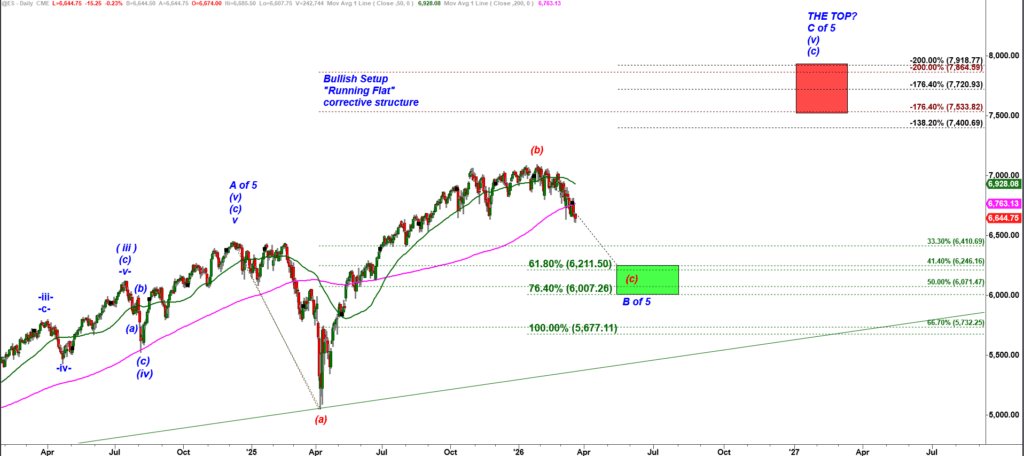
ES-mini Daily chart
Under that wave count bears can produce a strong drop down to the green box shaking off retail traders from the bullish train. That specific corrective pattern with a shortened subwave (c) down is normally followed by a strong rally in a wave C up to a new all time high targeting the Red Box.