#ES $ES #corrective a-b-c up pullback #Weekend
We have been tracking the corrective looking action off the Sep’25 high as an unfolding (a) down, (b) up, (c) down structure:
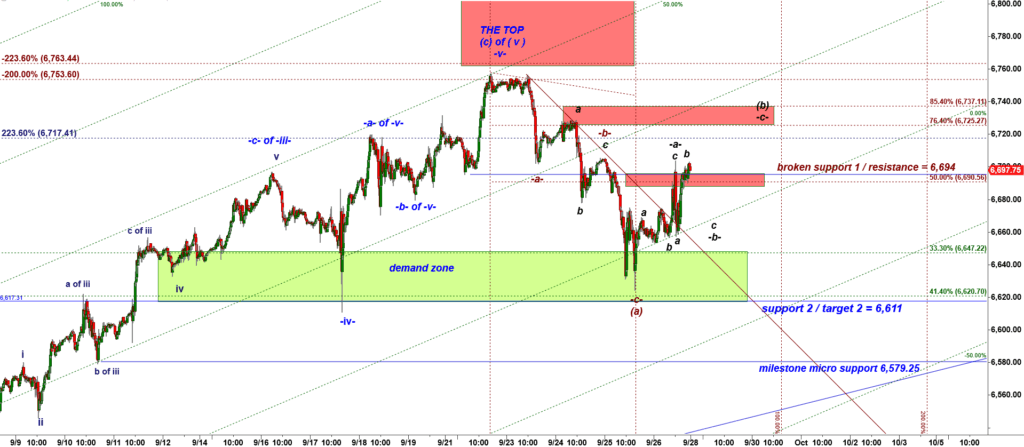
ES-mini 15 min chart
The -a-b-c- down structure of the wave (a) down bottomed on Thu, Sep 25.
Off that low made last Thursday we have been tracking an overlapping -a- up, -b- down, -c- up structure of the wave (b) up:
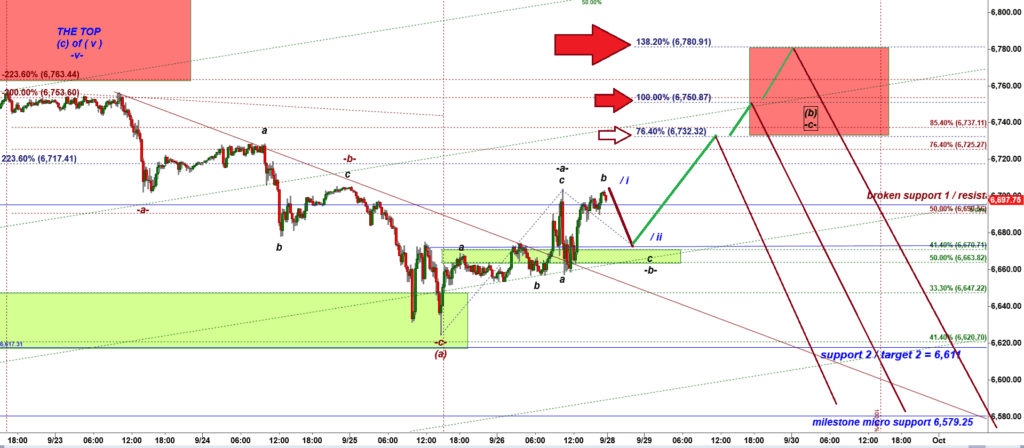
ES-mini 15 min chart
Normally, the subwave -b- down has a clean a down, b up, c down micro structure ( I am talking about the price action that started on Friday morning after ES-mini popped up before the market open).
Therefore I would count the Fri afternoon push higher as a micro wave b up of subwave -b- down of wave (b) up.
The rule of thumb is that a corrective wave (b) up takes more time than the first -a-b-c- move down in a wave (a) down. This is why a wave (b) up normally looks that complex and its structure looks so overlapping.
A wave (b) up normally just burns time wearing off bulls and bears.
The ideal follow through to the Friday afternoon move up is a move down. It is possible that ES either starts leaking down right at the open of the Sunday evenng trading session or (b) ES opens higher at or slighly over 6,705, a milestone resistance and then rolls over and start moving down. Under the (a) scenario where the Friday afternoon move up will not have follow through higher on Sunday evening bears will be able to push ES down to teh Green Demand zone startig at 6,675. However, if bulls manage to squeeze a higher high pushing ES up to 6,705, I would be expecting a shallow pullback down to 6,580
That short move down should be followed by an impulsive rally in a subwave -c- of wave (b) up targeting the Red Box.
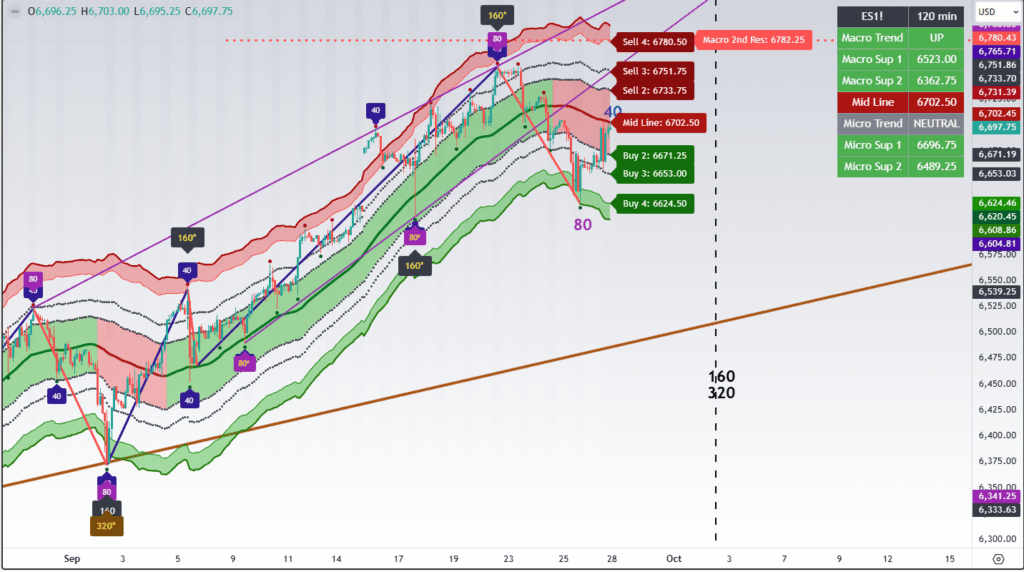
BONUS: Cycle Analysis:
I perform this cycle analysis using my brand new tool, a TradingView indicator called CAT Channel PRO MTF.
Based on that cycle analysis we can expect another leg down to complete the final down phase move of a 80 period cycle making a trough of a 160 trough and a 320 trough:
Below you can see a model showing how cycles of different magnitude and amplitude interact with each other making synchronized troughs:
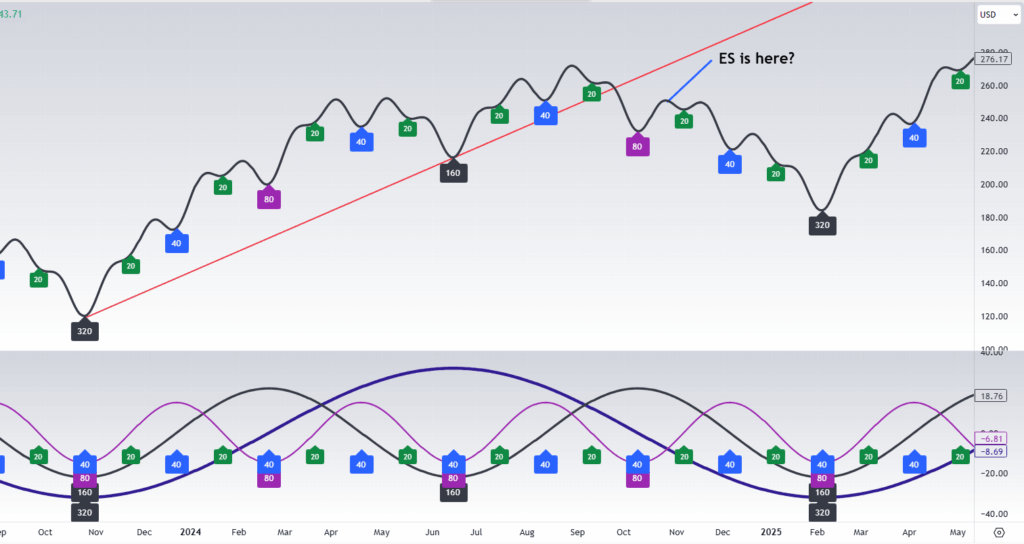
The Friday afternoon rally was most likely driven up by an up phase of both 40 and 80 period cycles (look at the model ). Now I expect the 40 cycle to turn down but the 80 cycle will still be pushing up.
Now add to equitation the 160 and 320 cycles that both pint down.
So its a big question whether the remaining part of the upward phase of an 80 period cycle will be able to squeeze a higher high or produce some kind of a double top.
The black composite line of the model shows a double top as a result of interaction between an up phase of the 80 period cycle trough and down phases of 160 and 320 period cycles.
The wave count shows above allows bulls to make another rally to the Red Box.