$ES #ES-mini #first a-b-c move down
ES-mini topped very close to the Red Target box and rolled over:
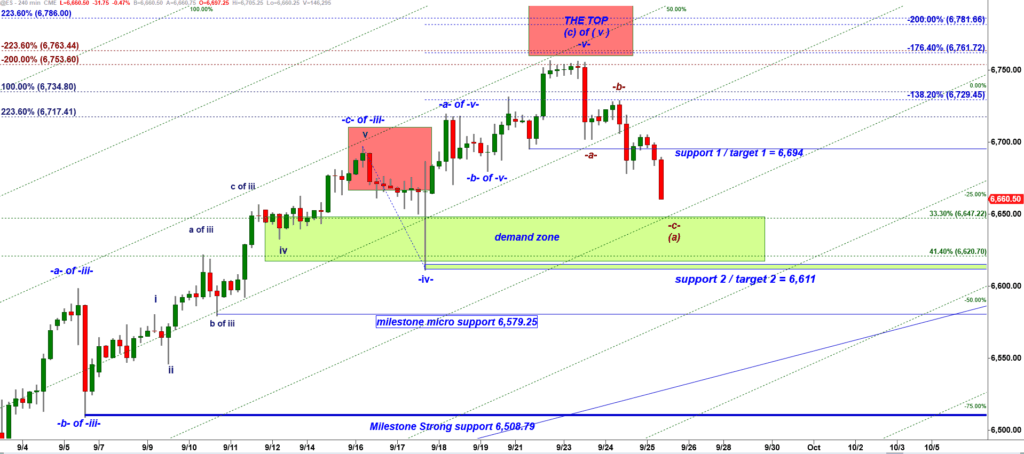
ES-mini 240 min chart
The green demand zone that started at 6,647.
I have coded and made available for subscribers of my indicators a new very powerful tool that detects cycles of different periods and classifies peaks and troughs:
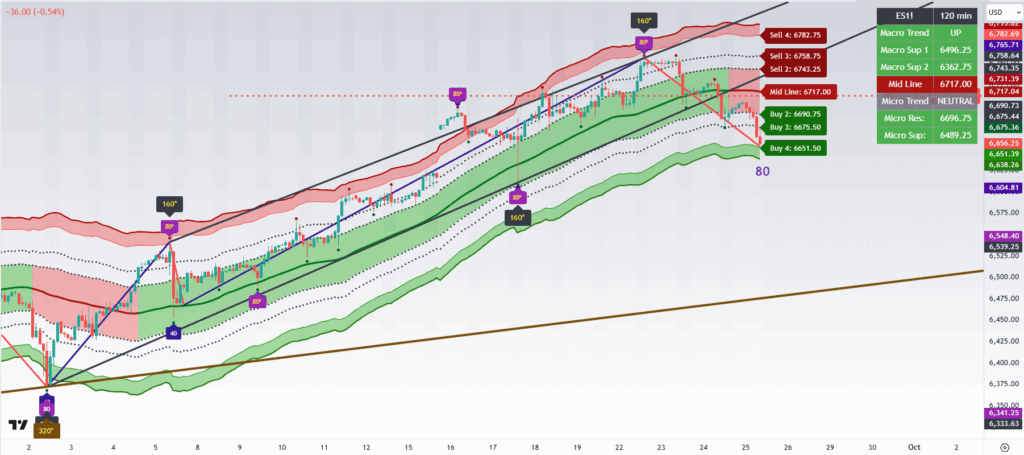
ES-mini 240 mn chart
Not ethat ES-mini dropped yesterday under the black trend line that connected two “160” troughs. That is a so called VTL line, a tool proposed by J.M.Hurst.
A VTL connecting two adjacent 160-day troughs is drawn by connecting the lows of two consecutive troughs of a 160-period cycle. This line represents the expected upward trend component that links those two troughs. As long as price stays above that VTL, the market is being driven higher by an upward phase of that cycle.
When price closes below the VTL: It confirms that the next higher period and stronger cycle (the 320 or 640 period cycle) has likely peaked! In that case Es-mini peaked in a 320 period cycle on Monday. And that means this move down is driven by a downward phase of a 320 cycle.
Let me show you a simplified model of cycles:
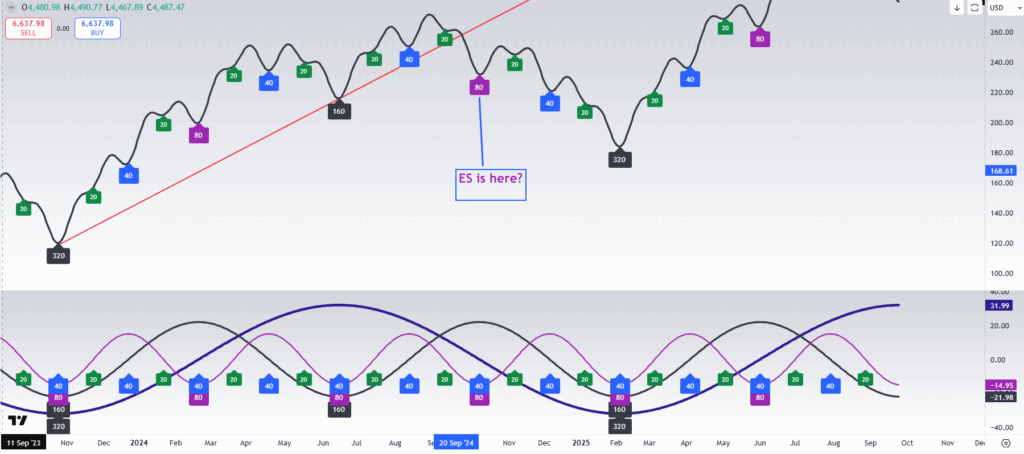
Cycle Model by CastAwayTrader
Note the red line connecting the two 160-160 troughs.
According to Hurst’s principles, once that trendline is broken, it confirms that a 320-cycle top (or even the top of a higher cycle) has formed. From there, we typically expect a significant downward move to complete a 320 trough (or a trough of an even higher cycle).
On the 120-minute chart, I manually added an “80” trough label. The reason is simple: by measuring the distance from the last recorded 80 trough, the timing now points to another one being due.
Now shift your attention to the mathematical model. If the cycle placement is correct, we may first see a minor pullback caused by the up-phase of an 80-cycle.
Look at the lower panel of the chart.
I’ve added arrows to illustrate the concept of conflicting cycle phases. Here’s the key insight:
- The 80-cycle will start pushing upward soon, but its power will be limited.
- Why? Because the longer 320 and 160-period cycles have been moving down. Their downward force dominates, pressing prices lower despite the shorter-term up-phase.
The key levels for today:
Resistance – the broken Daly support is 6,701.25(edited)
Support – – The Secondary Daily Support (reserved for down trending days) = 6,647.
The more important and stronger level of support is a weekly support for the NEXT week which now stands at 6,631.75
So bulls will be trying to close this week OVER 6,631.75 because that is their first macro line of defense for the next week.