#ES-mini $ES #bullish path
Our bullish wave count allowed us to correctly predict a corrective pullback and correctly anticipate where that pullback would find support (see the Green Demand zone).
The base case wave count allows bulls to push ES-mini up to 6,729.
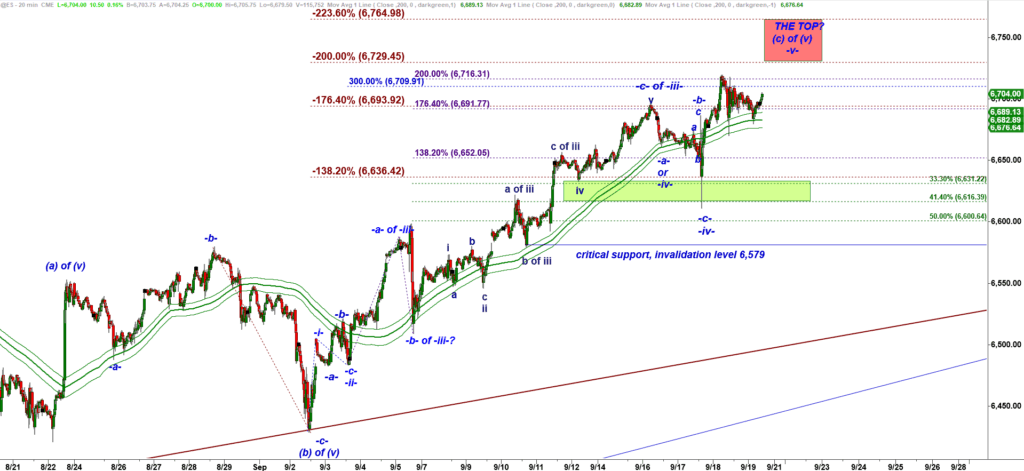
ES-mini 20 min chart
I can share a more bullish wave count based on a tick bar chart:
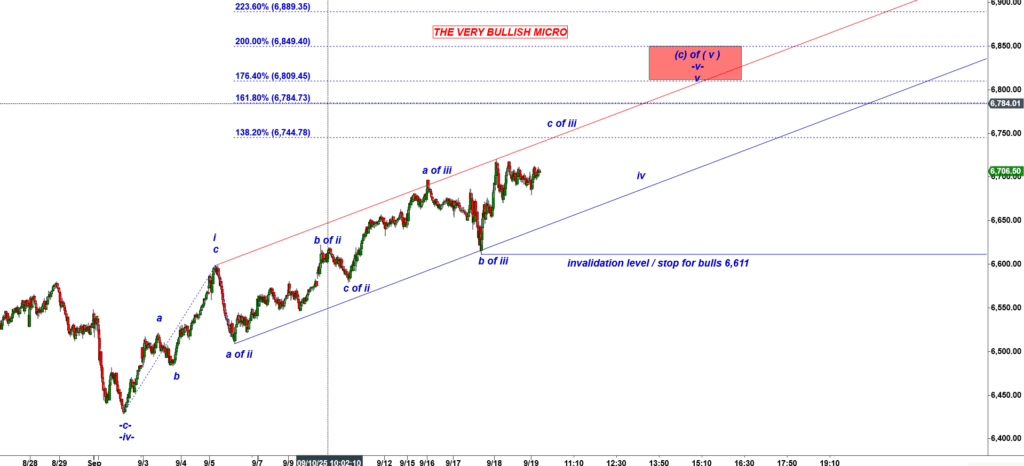
ES-mini 13,500 tick bar chart
The NQ Daily chart looks very bullish:
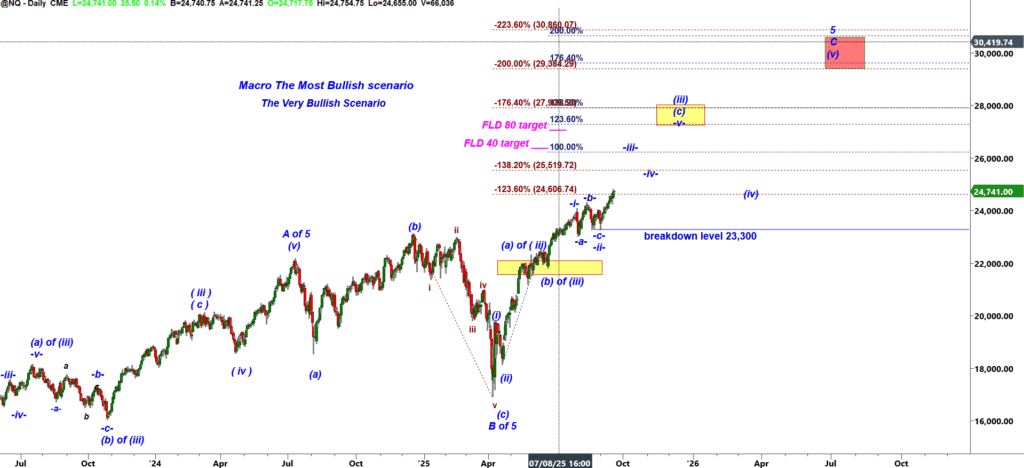
NQ-mini Daily chart
Until bears manage to break the invalidation level 23,260, bulls would be able to push NQ much higher:
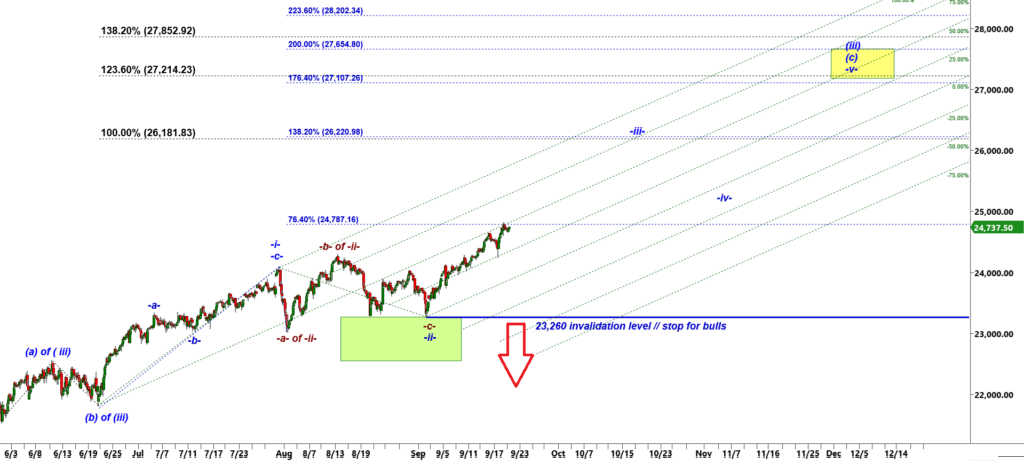
NQ-mini 120 min chart
We can conclude that bears shall patiently wait for break under 23,260 support in NQ and break under 6,611 support in ES-mini. Break under those levels of support should make you close the majority of your long positions.