$ES #Very Bullish #Acceleration
Bulls keep pushing ES-mini higher, as we expected. This is our primary Very Bullish wave count / scenario:
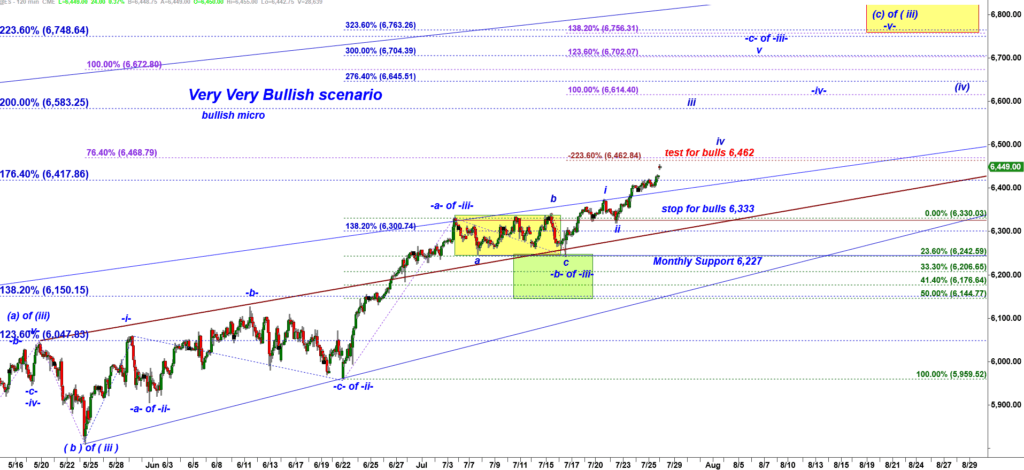
ES-mini 120 min chart
Let’s zoom-in to a 15 min chart.
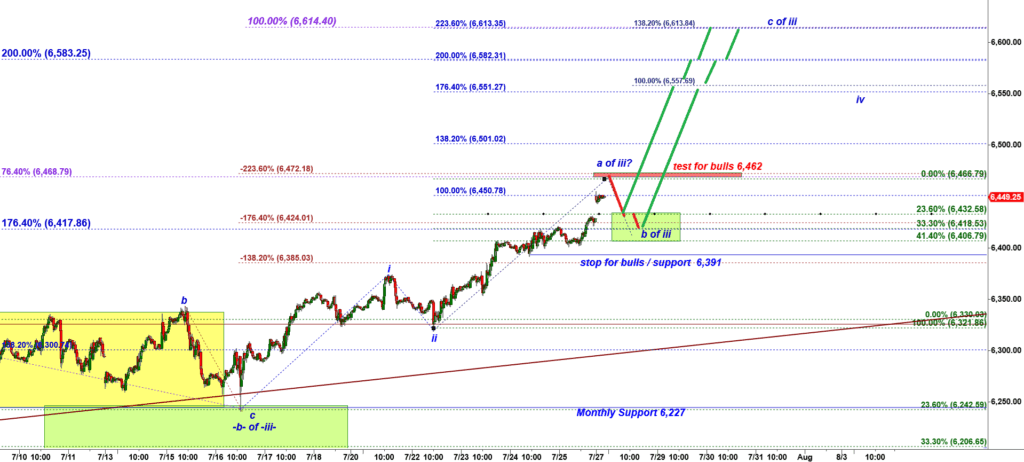
ES-mii 15 min chart
The Red Box is the macro test zone. A negative -138.2% extension of the preceding corrective pullback is the max allowed level that can be reached by a strong corrective wave.
Under the Very Bullish wave count we should not expect a very strong decline off that level. The very bullish scenario argues that the rally will only take a pause once it hits that red box at 6,462 – 6,472. A shallow consolidation in a subwave b down of wave iii of -c- of -iii- up should find support at 6,416 – 6,406. That would be the the crucial test / confirmation of the Very Bullish scenario.
If bears fail to break under 6,406 we should expect a very strong accelerated rally up to 6,550 with possible extension to 6,580.