$NQ #NQ-mini #trading setup #Elliott Wave
That pop looks like a textbook subwave c in a corrective a up, b down, c up structure shaped as a very bearish running flat corrective structure, a consolidation that builds a base for yet another strong move down:
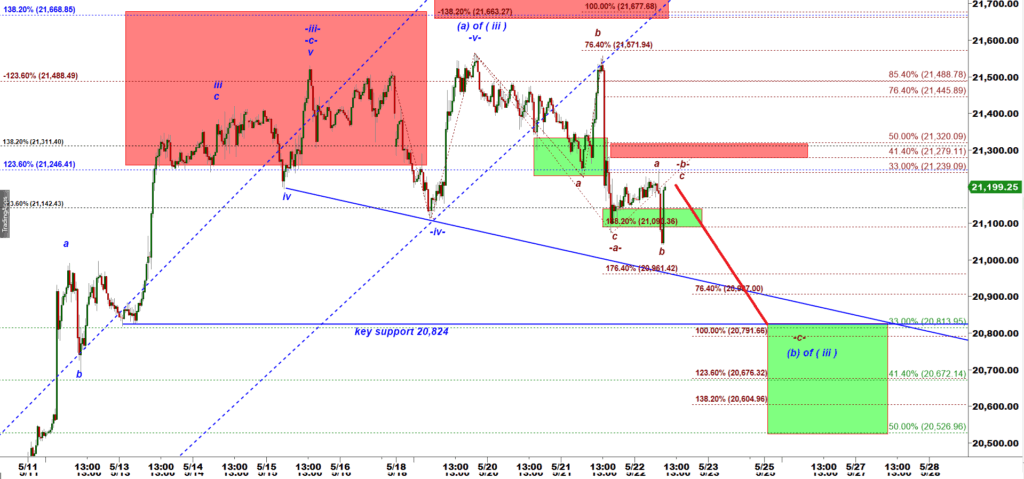
NQ-mini 30 min chart
Below is a micro analysis based on levels calculated and drawn by my Cycle Trader Indicator for Tradingview:
NQ is in a down trend on a daily timeframe after it broke under the blue Daily support yesterday:
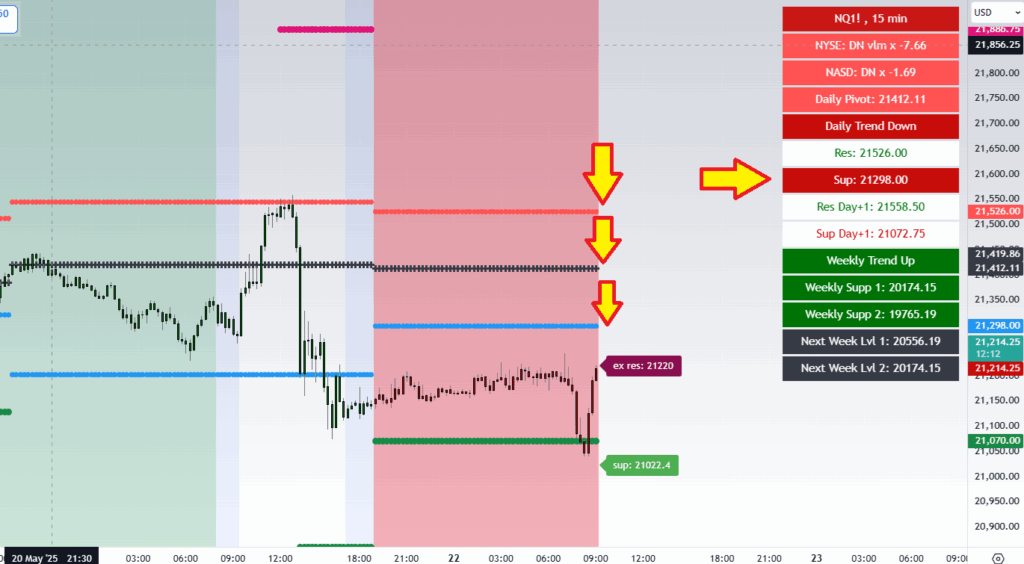
NQ-mini 15 min chart
It has tested the green Secondary support 21,070 pre-market and bounced up off that support.
The blue daily support for today is 21,298. Because price opened the day UNDER the support, that level should be considered an immediate micro resistance. As long as bulls hold NQ under the blue Daily support they will remain in control.
Break back over 21,298 would cast doubts over the bearish scenario described on the first chart above.