$ES #failed breakdown
Yesterday, bears tried to ignite our short-term bearish scenario by piercing the immediate support at 5,497.75, but they couldn’t sustain the breakdown. That failure handed the bulls fresh momentum, allowing ES to climb and test the next resistance at 5,636.
Failed breakdowns and failed breakouts remain the most reliable setups in that algo driven market.
ES-mini 120 min chart
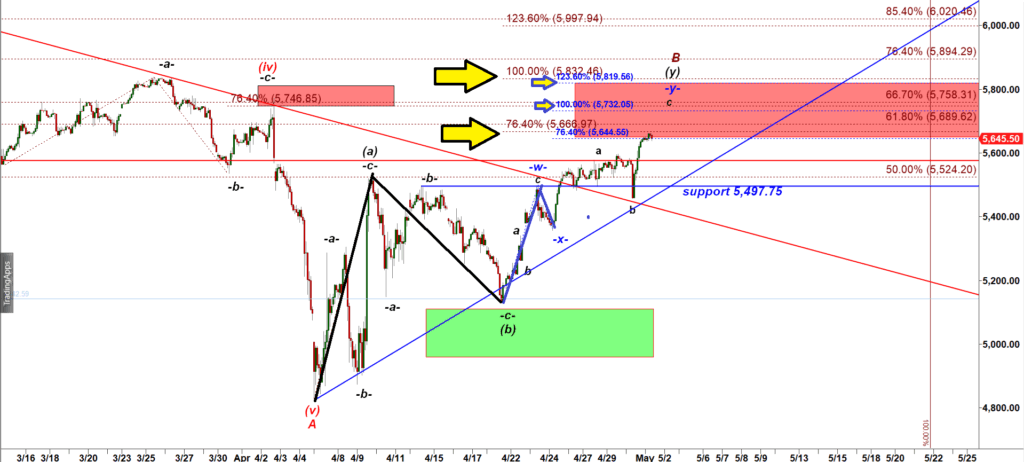
At this stage, there’s no sign of bullish exhaustion—buyers look poised to carry ES up toward 5,732–5,747.
When we map out the Double-Three corrective structure (an (a)-(b)-(c) pattern), we track two distinct extension measurements:
- Wave (a) extensions (see black arrows on the chart)
- Wave (c) extensions, measured from the first push within the second leg
These generate two confluence zones to watch:
- Cluster 1: 5,644 – 5,667
- Cluster 2: 5,819.50 – 5,832.50
Keep in mind, the hallmark of any corrective bounce after a sharp decline is to lure in bullish participants—and that’s exactly what we’re seeing here.