$NQ #NQ-mini
This is my favorite forecasting technique in action:
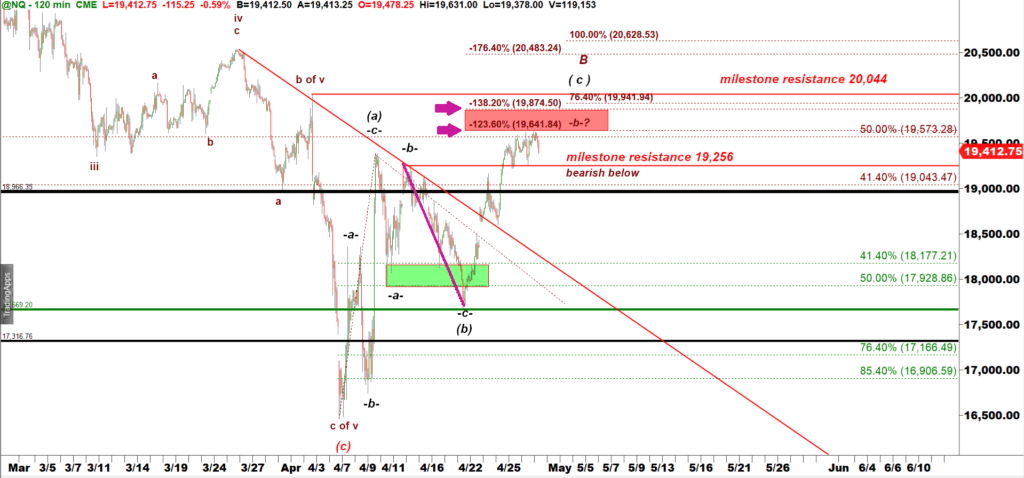
NQ-mini 120 min chart
We measure a preceding decline from top to the bottom (see the purple line).
And then we add negative extensions. The red target box for the subsequent rally should be placed in between of -123.6% and – 138.2% ext. If price manages to break over the red box, it will most likelt extend up to – 176.4%ext = 20,483
I posted three video lessons in my Pro Course explaining that forecasting tool:
You can subscribe to that course here, I share a link with a big discount.
In conclusion:
- So NQ has hit the lower boundary of the Red Box. At this point the very last broken resistance 19,256 is our immediate support.
- Break under that level would confirm NQ has topped in a corrective subwave -b- up of wave (b) down.
- As long as bulls hold NQ over 19,256 they will be able to push NQ higher and test the upper boundary of the Red Box = 19,874.50.
Addition: $ES-mini has the very same wave count:
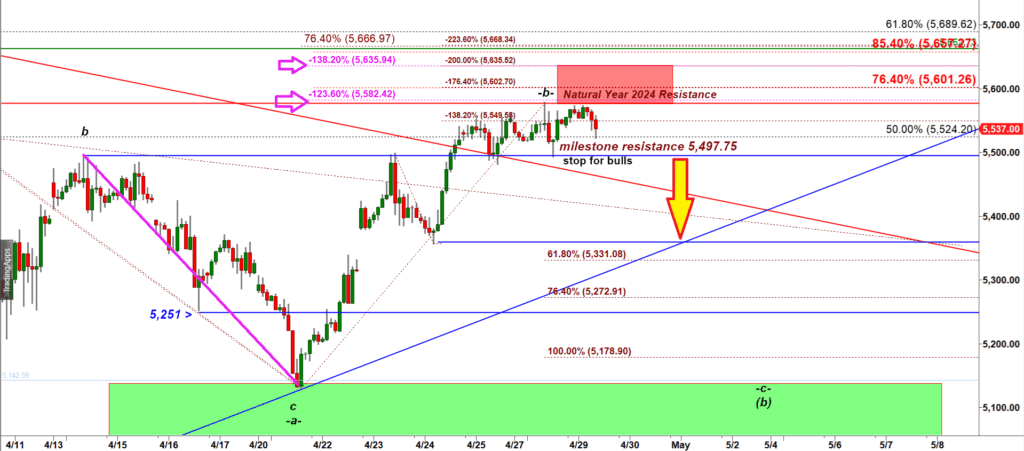
ES-mini 120 min chart
As long as bulls hold ES-mini over the immediate support 5,497.75 they will be able to push ES up to the next resistance 5,636. In contrast, if bears manage to break under the immediate support 5,497.75, I would expect decline at least down to 5,380.
NQ-mini 120 min chart