$ES #Elliott Wave #trading setup
This morning I shared my bullish view:
…”The only micro wave count I can see assumes wave -c- of ( y) is shaped as w-x-y structure. In that case bulls should be able to make two more legs up in a of y and then in c of y up”
Welll, ES-mini rallied more than 120 pts after that report was posted:
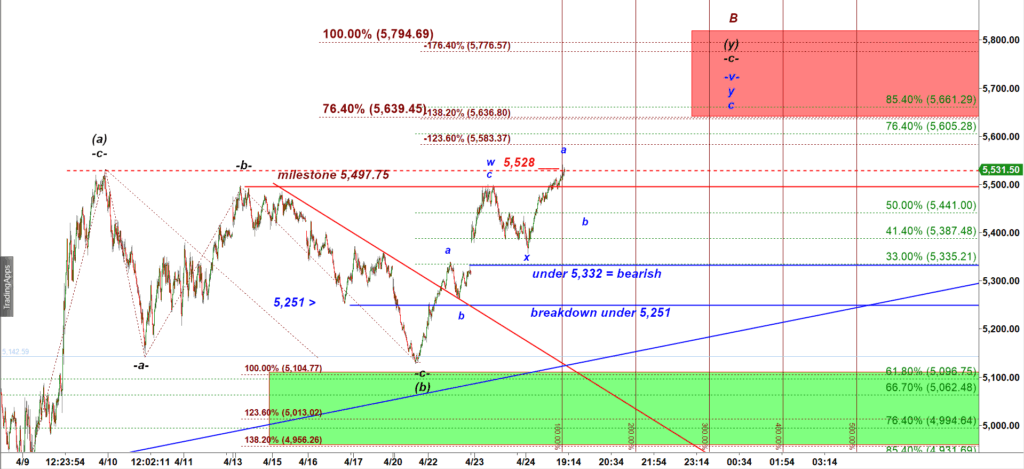
ES-mini 120 min chart
As you can see, there is still a lot of room for further upside.
However, I expected that rally to be shaped as an a-b-c up move. And today we have got the first leg up in a subwave a.
Because I consider the whole (a) up, (b) down, (c) up structure off the early April’25 low as a corrective structure, I would expect this specific wave a to top at either a negative 123.6% or 138.2% ext of the preceding decline:
Let’s zoom-in:
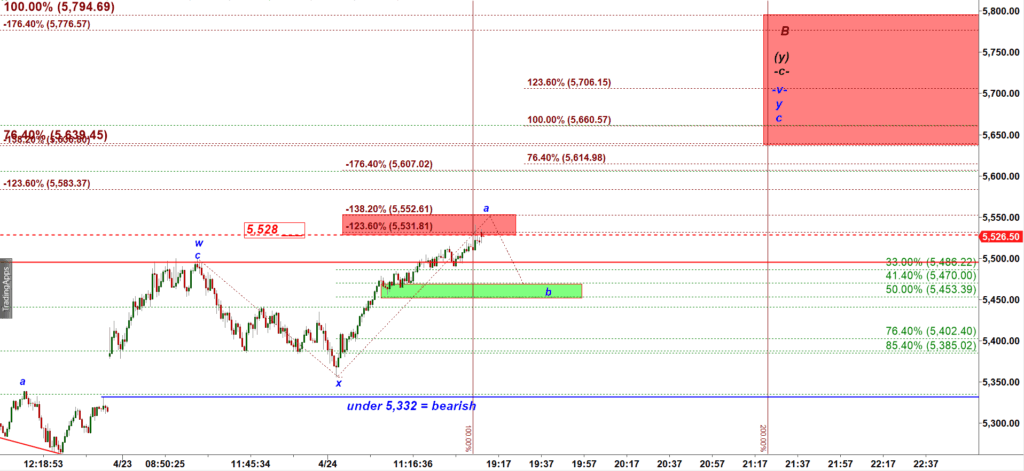
ES-mini tick bar chart
As you can see, ES has tagged the ideal target for this rally. The lower red box is located in between of those two negative extensions 123.6% and 138.2%. Bulls can push ES to 5,552.50 to tag the upper edge of the Red Box.
I expect to get a pullback off that lower Red Box down to the Green Box in a subwave b down, followed by the final push up to the upper Red Box in a subwave c up.