$ES #ES-mini #Elliott Wave #trading setup #Elliott wave
I can remind you about two main macro scenarios we have been tracking. Let’s start from teh alternative low probability Bullish scenario:
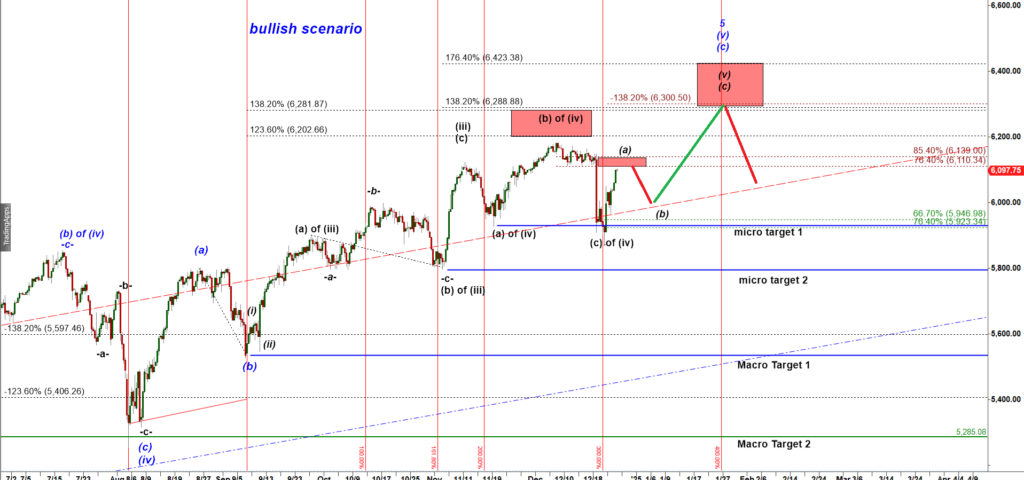
ES-mini 8 hour chart
The bullish wave count interprets the sharp December 2024 drop as subwave (c) of wave (iv) down. If this drop marked the completion of wave (iv), bulls could potentially drive ES to a new all-time high in the final micro wave (v) up, targeting the larger Red Box that begins at 6,300.
Ideally, wave (v) up would unfold in three parts: (a) up, (b) down, and (c) up, ultimately reaching the Red Target Box. The current rally might represent the initial weaker leg of subwave (a) up, which could be followed by a significant retracement in subwave (b) down.
However, it’s crucial that subwave (b) down of wave (v) does not break below the starting point of subwave (a) up (the low formed during the December pullback). In simpler terms, subwave (b) down should create a higher low to maintain the bullish structure.
The primary bearish wave count argues that ES-mini made a major top in Dec 2024:
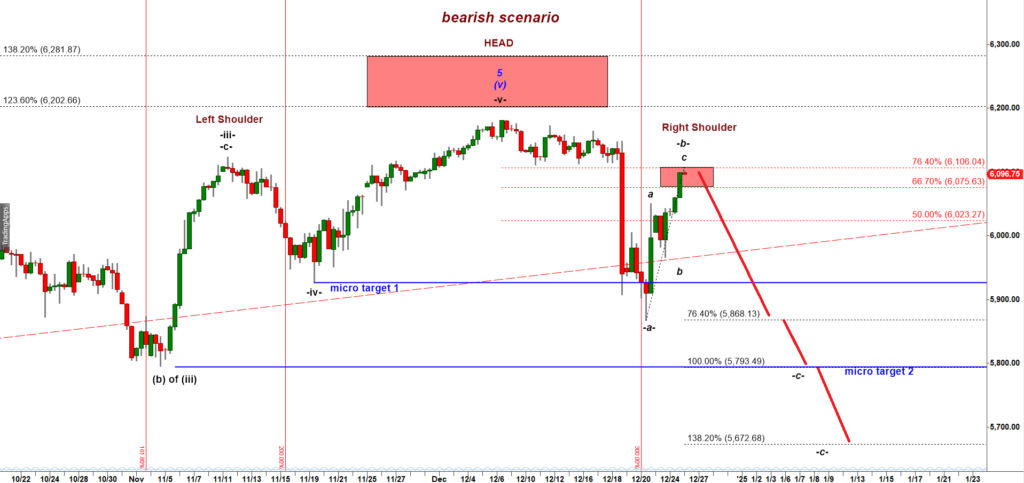
ES-mini 8 hour chart
The primary bearish wave count suggests that ES-mini made a major top in December 2024. According to this wave count, the initial drop was just a small first move down, which should eventually lead to much lower targets.
I’ve shared the key targets a week ago:
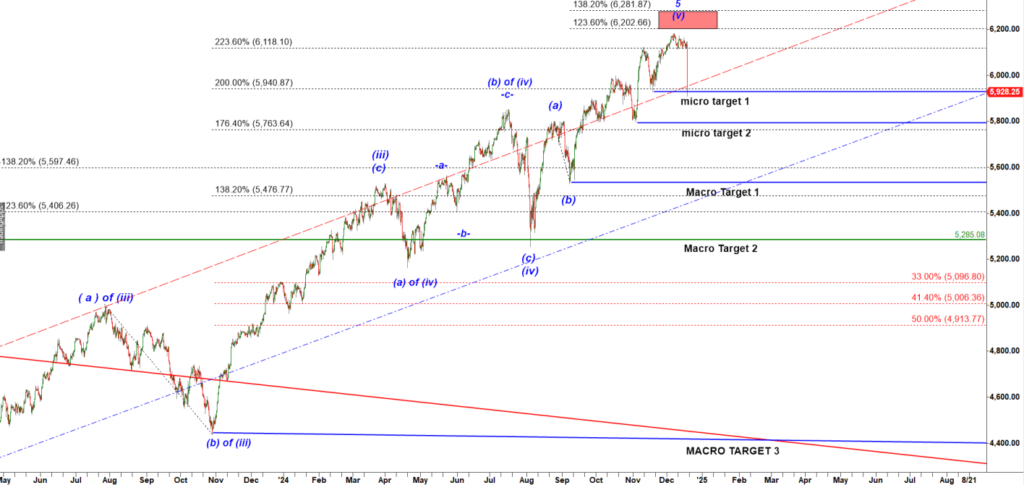
ES-mini Daily chart
As shown, the first drop reached Target 1, a strong support level. Typically, such a drop is followed by a corrective bounce that forms a lower high. Historically, these bounces often fail near the 76.4% retracement of the drop — and as you can see, bulls have tagged that level.
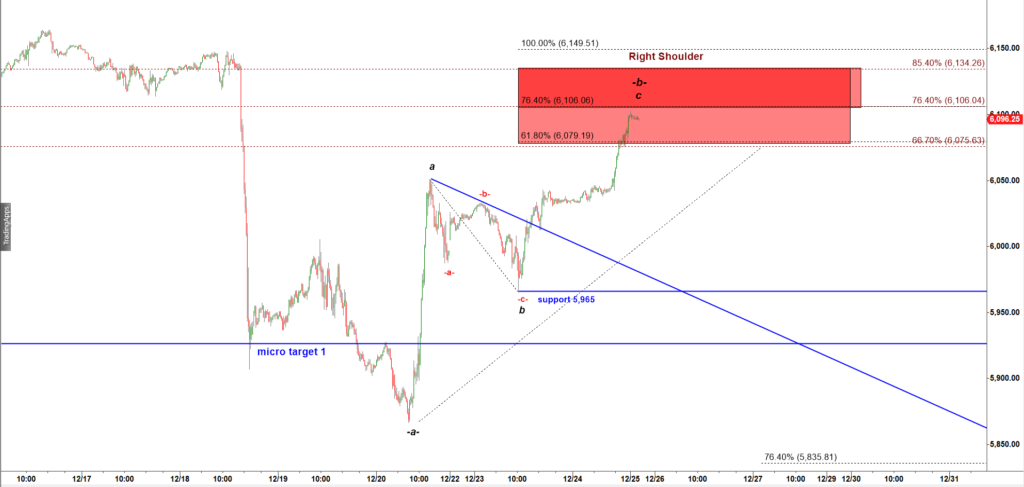
ES-mini 15 min chart
On the micro 15 min chart you can clearly see that this rally looks corrective because it has a clean three wave a-b-c up structure.
The bears now have a bearish setup that positions them to drive ES lower and initiate a significant new leg down, targeting the micro target of 5,800.
In summary, 6,106 remains the critical resistance level — the “Maginot Line.” As long as bears keep ES below this level, the bearish scenario will remain the preferred primary outlook. However, a decisive break above 6,106 would greatly increase the likelihood of the bullish wave count or scenario unfolding.
FYI The Maginot Line was a line of fortifications built by France along its eastern border in the 1930s, designed to defend against a potential German invasion. It was heavily armed and thought to be impenetrable, but Germany bypassed it during World War II by invading through Belgium, rendering the fortifications ineffective. The term “Maginot Line” is now often used metaphorically to describe a critical but potentially vulnerable defensive barrier.