$ES #ES-mini #i down – ii up setup #invalidation
The Elliott Wave principle tends to work best when the market is in motion and trending.
That is when its backbone structure — the classic five-wave impulsive move — becomes very clear and reliable.
However, when momentum fades and the market enters an extended period of directionless, range-bound trading, Elliott Wave analysis becomes less efficient. Consolidations like that can eventually resolve in either direction, making them difficult to interpret in real time.
From a Wyckoff perspective, the same structure could be interpreted in two very different ways. It might represent distribution at the top, or — if price ultimately breaks to new highs — it could instead be a re-accumulation phase before another leg higher.
I have been watching that bearish scenario that allowed bears to produce a quick and big drop down to the green box:
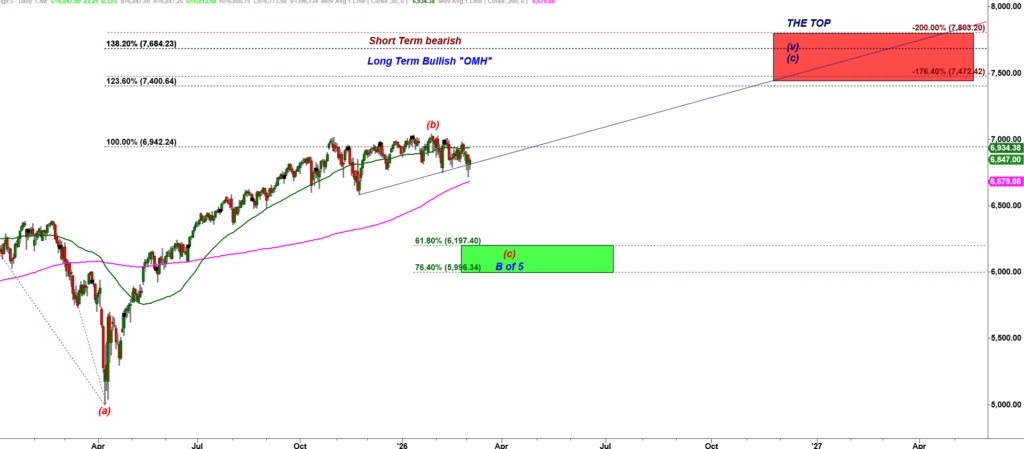
ES-mini Daily chart
However, so far bears have not been able to trigger that short setup.
The 30 min chart below shows this type of overlapping consolidation.
Bears argue that the larger move down has not even started yet. In their view, the recent decline would only be the beginning of a –i– down, –ii– up short setup. Indeed, bears could argue that if we expect a wave -c- down it should mimic the impulsive five wave down structure.
For now, we can keep that bearish scenario on the table as long as ES remains below the upper edge of the red box at 6,916.
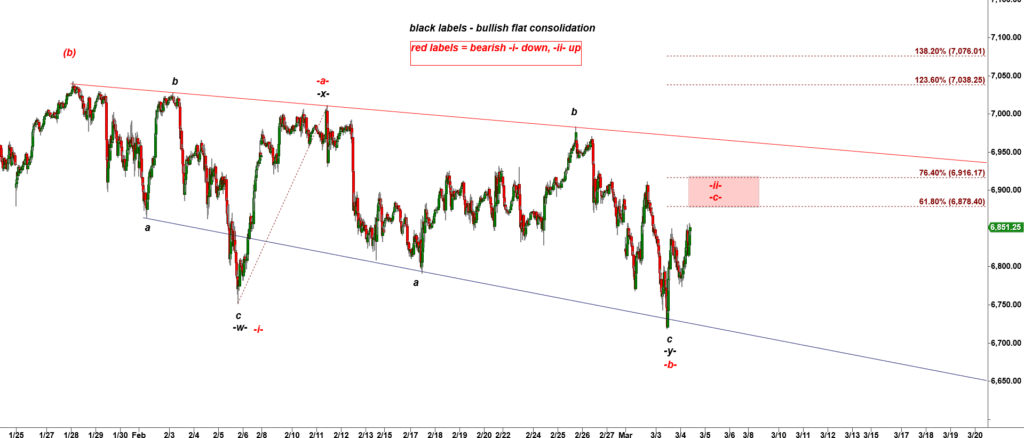
ES-mini 30 min chart
🟩 A breakout above the red box would be a very bullish signal.
At that point, bears would likely be forced to abandon the short thesis and begin covering positions, potentially fueling a strong move higher.
🚨 For the bearish scenario to stay valid, bears need to produce a clear rejection from the red box — ideally from the lower edge around 6,878.50.
That type of rejection could activate the –i– down, –ii– up structure, opening the door for a decline toward 6,520.
Month Opening Range Setup:
Today the market will complete the Month Opening Range for March 2026.
So far the preliminary levels are:
Monthly Support: 6,718.75
Pivot (midpoint): 6,815
Monthly Resistance: 6,911.25
For those who are new, a quick reminder of how the Month Opening Range works.
At the beginning of every new trading month, the market typically experiences elevated volatility. Institutional flows reset, new capital is allocated, and price tends to make wider swings as the market establishes a new trading range.
We define the Month Opening Range as the high and low formed during the first three trading days of the new month.
Those levels often become important reference points for the rest of the month, acting as support, resistance, and key decision zones for traders.
As always, we closely track the high and low established during the first three trading days of March, since those boundaries frequently influence price behavior for the following several weeks.