This morning we see a standard bullish pattern – break over a resistance – followed by a retest from above:
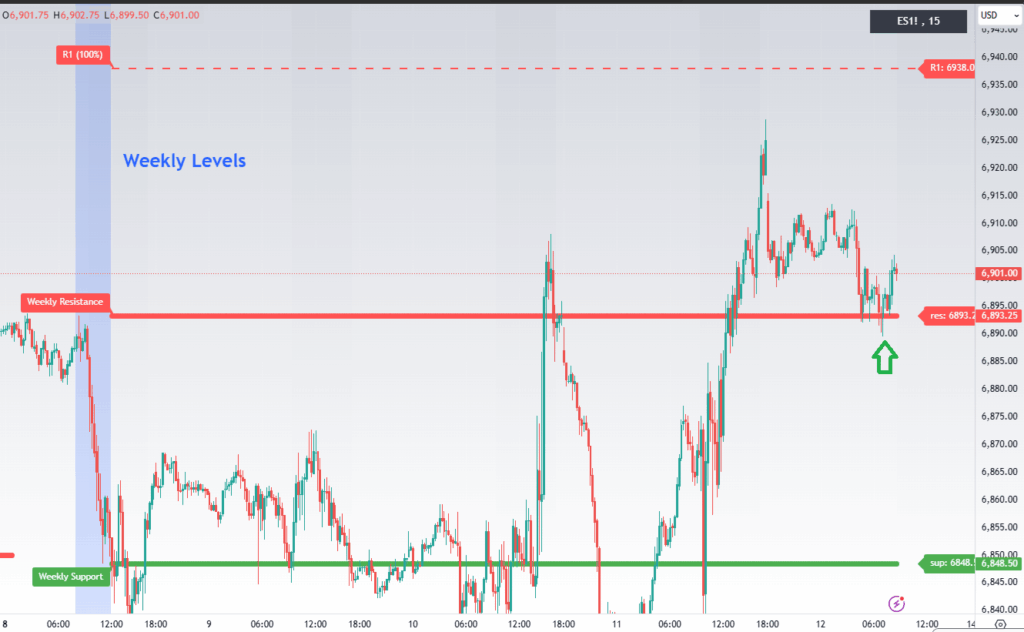
If bulls defend the broken-resistance-turned-support 6,893 we should expect a rally to weekly R1 level = 6,938.
Every day I start from sharing the big picture and reaffirm that the chart looks bullish:
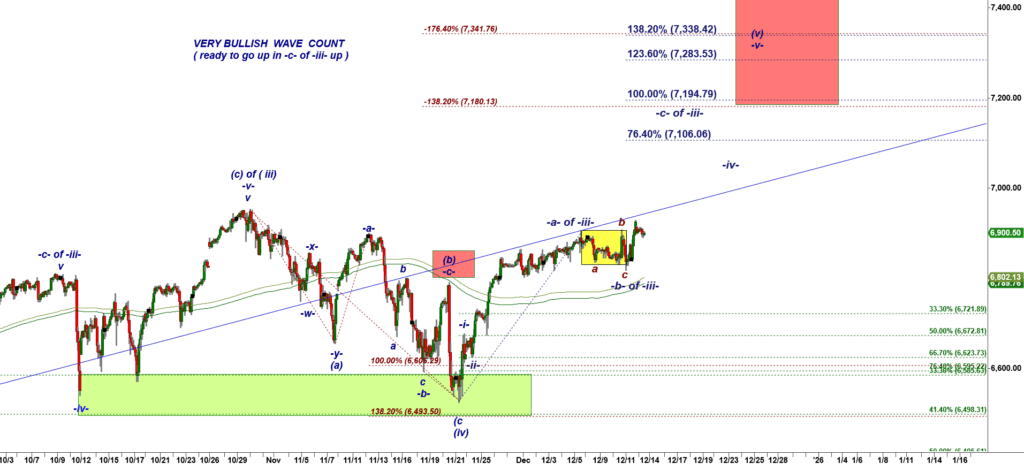
ES-mini 120 min chart
The straightforward bullish scenario allows bulls to trigger an accelerated rally in a subwave -c- of wave -iii- up fueled by trapped bears rushing to cover shorts that did not work (yet again). I always highlight flat a-b-c down consolidations with yellow rectangles. That is re-accumulation pattern. However, Bears consider that a distribution pattern and they keep adding shorts. And when suddenly price breaks out of that range short sellers get caught off-guard and have to chase the runaway train.
This is why the wave -c- of wave -iii- up does not take prisoners. It just keeps charging higher without meaningful pullbacks. Again, the reason why it accelerates because of bears who went short in the yellow box.

published at 11:20 AM EST
This morning I noted: “If bulls defend the broken-resistance-turned-support 6,893 we should expect a rally to weekly R1 level = 6,938.”.
However, bulls failed to defend that support and that failure encouraged bears to push ES down to the confluence of weekly support and monthly support levels.
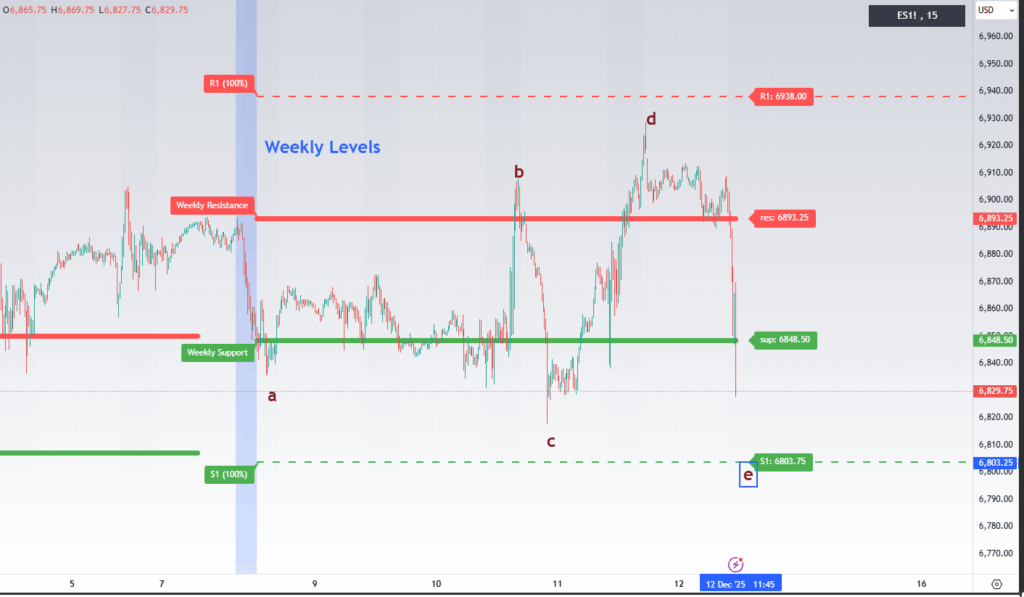
Now that whipsaw drawn this week looks like a corrective Expanded Triangle structure. In Expanding Triangle the final subwave e down is the largest. It undercuts the low of the previous subwave c down. But the expanding triangle is still a corrective structure and it still allows bulls to start a rally upon its completion.
A bigger picture on a 120 min chart remains bullish even under that drop:
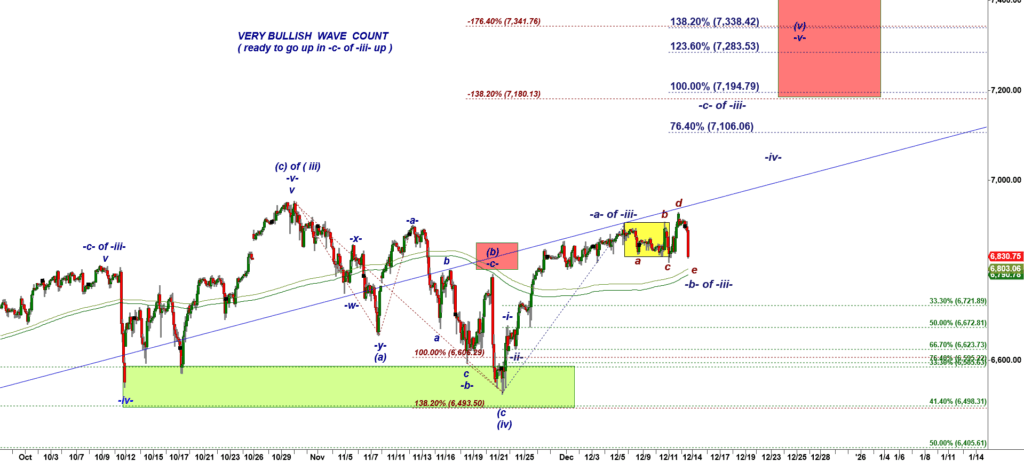
ES-mini 120 min chart
That drop pushed ES-mini back to the strong Monthy Support 6,805:
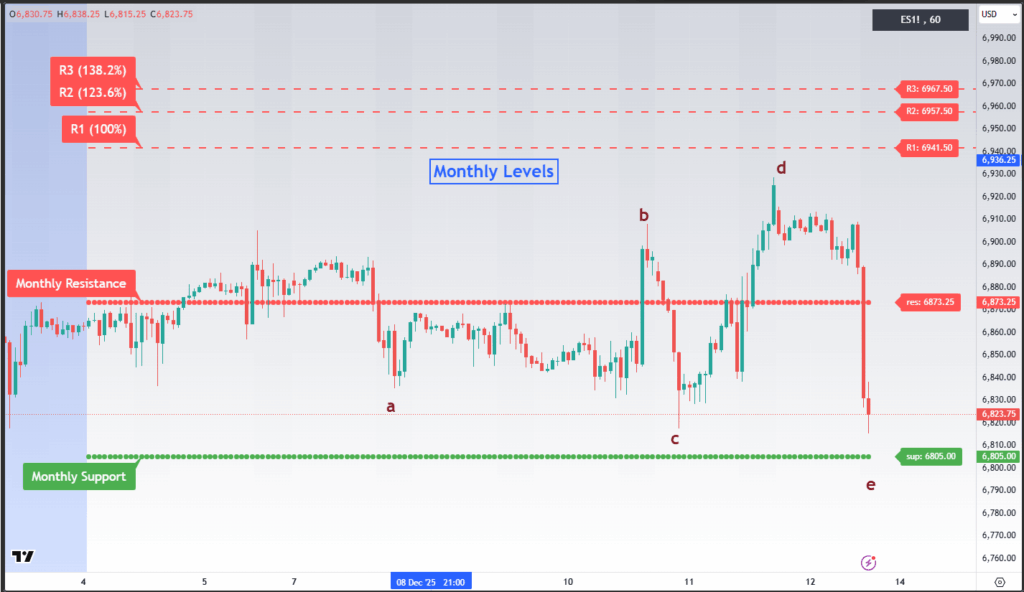
Bulls have to stop that drop at 6,800 by the end of the day.
If bears break under the Monthly Support and close a week under 6,800 I would take all bullish bets off.