$ES #weekly_levels #i_up_ii_down_setup
Bulls started the rally we expected after ES tagged the Green Demand Zone:

ES-mini 120 min chart
In the bullish scenario we should get a five wave up structure pushing ES to a new all time high (see the red box).
After the first impulsive looking rally off the low made last Friday (we can count it as -i- up) we should get some pullback that could be counted as a micro wave -ii- down.
Let’s zoom into a 15 min chart:
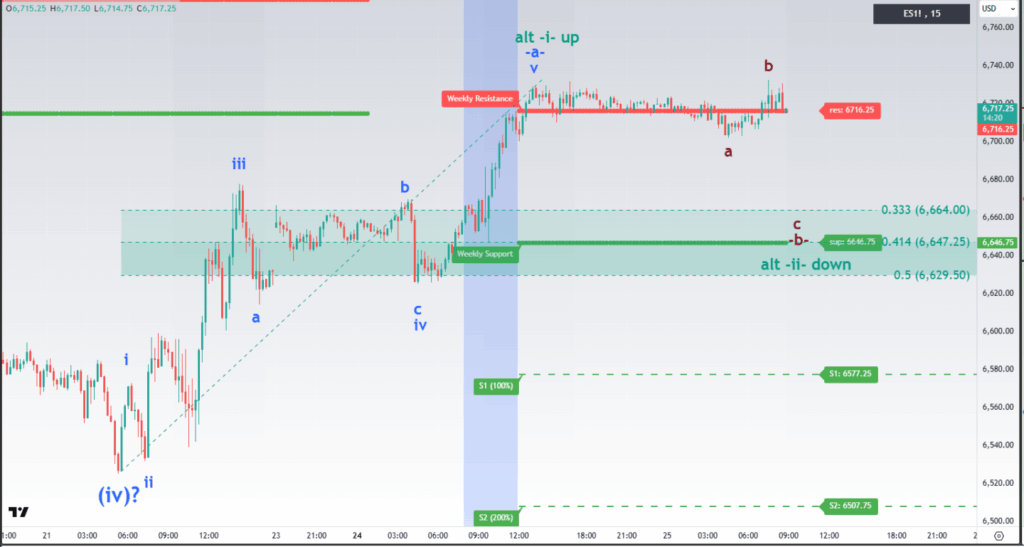
ES-mini 15 min chart
On the 15 min chart you can see fresh weekly levels formed on Monday.
Note that the rally stalled right at the red Weekly Resistance 6,716.25.
Bears may try to test the weekly support 6,647.25.
Daily levels (for day traders):
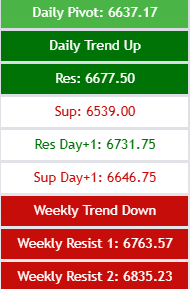
Note: bulls have turned the trend up on Daily but the weekly trend is still Down. To turn the weekly trend up bulls need to close a day over the weekly resistance 2 = 6,835.25. The key daily support is the broken daily resistance 6,677.50.
The key daily support is the broken daily resistance 6,677.50. In an up-trending market a broken resistance works as a trailing support. If bears test that level from above but fail to break it, that would be a solid confirmation of the bullish momentum.