$ES #ES-mini
That was our micro path for yesterday:
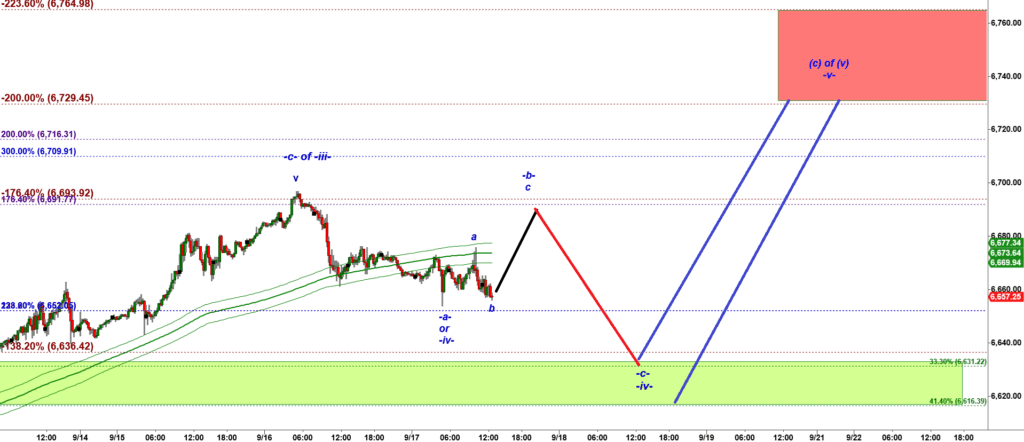
ES-mini 15 min chart published on Sep 17, 2025
Yesterday ES perfectly followed the black segment up and then plunged in the red segment into the Green Demand Zone. We expected that the drop will be bought out and failure of bears to break under that green demand zone would be followed by a new rally targeting the Red Target box.
This is how a 240 min chart looks like now:
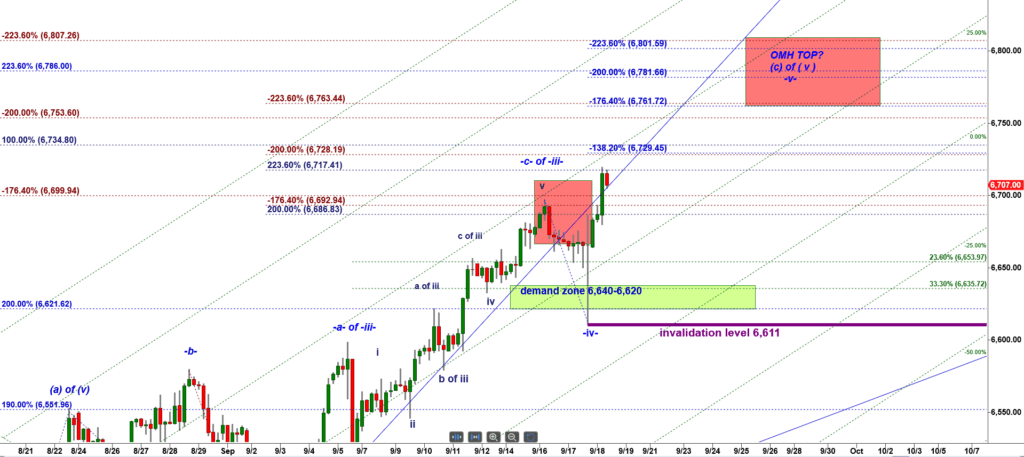
ES-mini 240 min chart
As you can see, I made two minor yet important changes:
(i) I have moved the critical support / invalidation level up to the low made by post FOMC spike down = 6,611
(ii) I have moved the Red Box a bit higher. Now it starts from 6,761 a negative -176.4% ext of the drop in a corrective wave -iv- down.
Note the micro resistance 1 is always a negative – 138.2% ext of the last completed corrective wave.
In our case that is a wave -iv- down and its negative -138.2% ext = 6,729.50. That is the first micro resistance.
Let’s look at a tick bar chart:
It is possible that we will get a micro pullback this morning to test the micro green demand zone from above to be followed by another strong leg up:
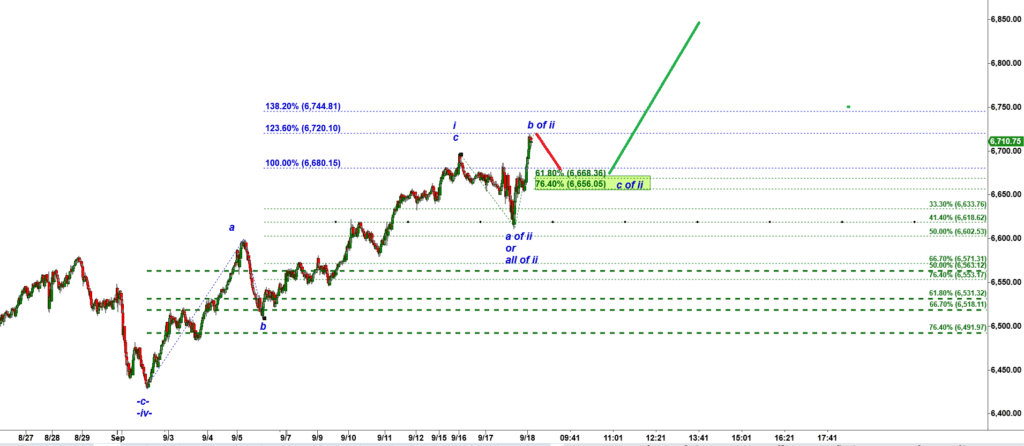
ES-mini tick bar chart