$ES $SPX #Elliott Wave #trading setup
The quick drop on Friday afternoon could be counted as a micro wave iv down that can be followed by one more push higher in a micro wave v up:
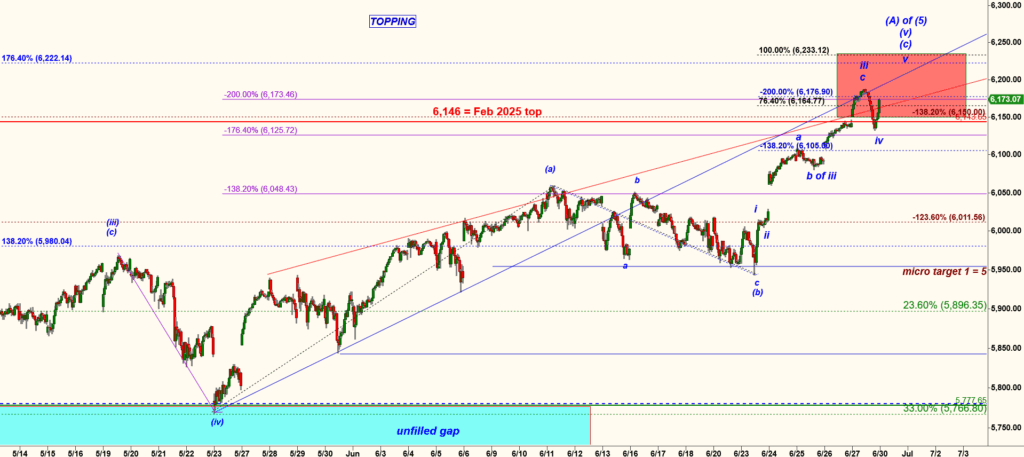
SPX 15 min chart
Note that the key resistance level for the S&P 500 cash index remains the February 2025 high at 6,146.
On Friday, bulls briefly overshot that macro resistance level, pushing above it—but the move didn’t stick. The price quickly reversed and retested that level from above.
So, was that a true macro breakout?
Not yet. This price action fits a classic failed breakout schematic, a pattern we often see near major resistance levels:
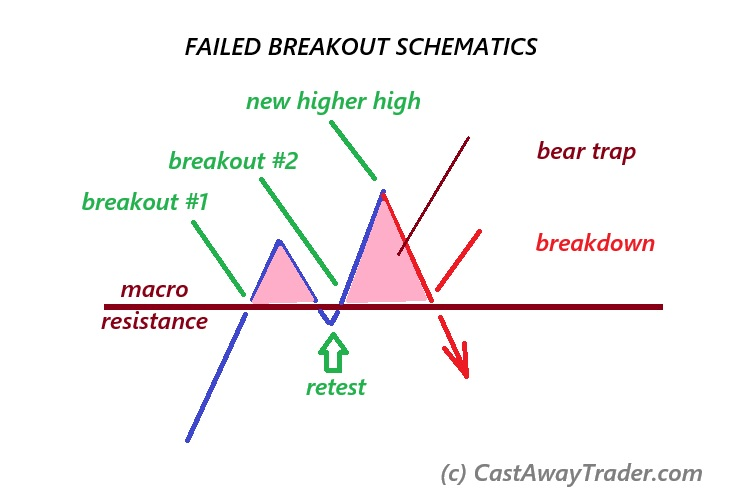
As shown in the diagram, the first breakout attempt is often followed by a pullback and retest. This happened at 3:00 PM EST on Friday, when the S&P 500 retested the 6,146 level from above.
That retest reinforces 6,146 as a critical support level going forward. A clean break back below this level would activate the classic “failed breakout” setup—a bearish signal that could lead to a sharp downside move.
Until then, bulls are still in control—but hanging by a thread.
This is how a potential corrective path looks like on the 120 min SPX chart:
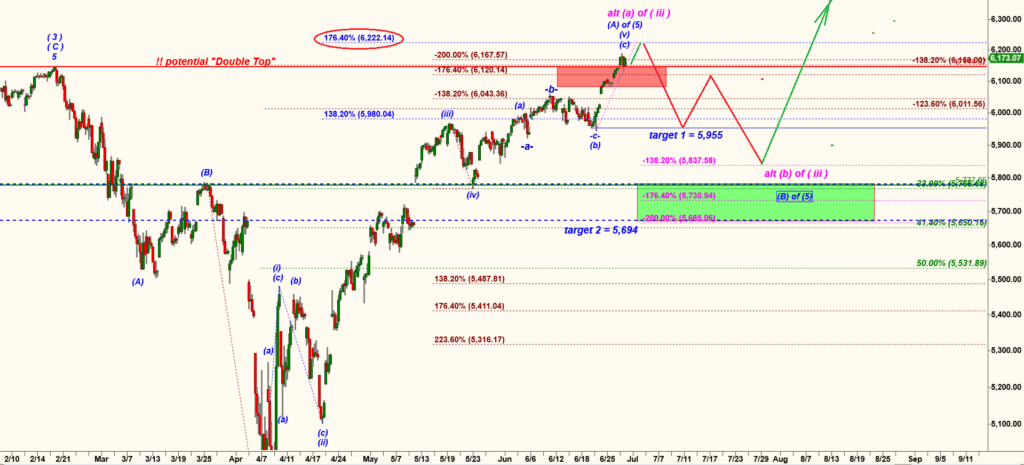
SPX 120 min chart
Both wave counts I watch only allow bears to produce a relatively large (a) down, (b) up, (c) down corrective structure that can retrace from 33.3% to 41.4% of the preceding rally that started off the April’25 low.
This is how that same topping wave count looks like on ES-mini 240 min chart:
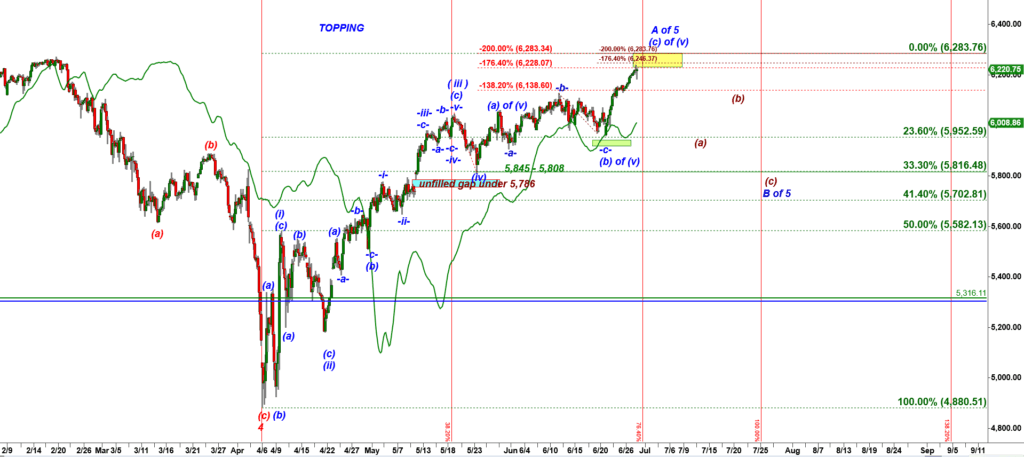
ES-mini 120 min chart
On Friday ES-mini has hit the lower boundary of the yellow box. We can non exclude possibility for bulls to push ES higher and tag the upper boundary located at 6,283.
Let’s zoom into a micro tick bar chart to see every detail of that last push higher:
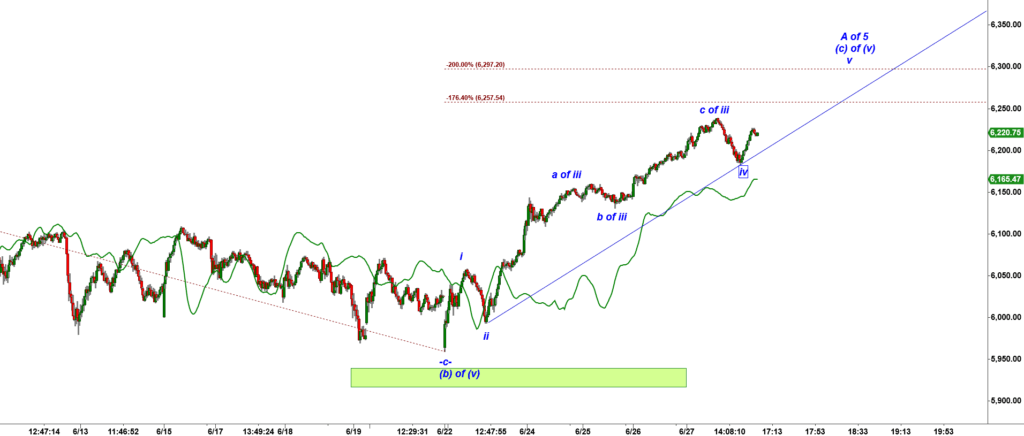
ES-mini 13,500 tick bar chart
The Fri afternoon drop can be counted as a micro wave iv down to be followed by a push to a higher high in a micro wave v up.