$ES #ES-mini #Elliott Wave
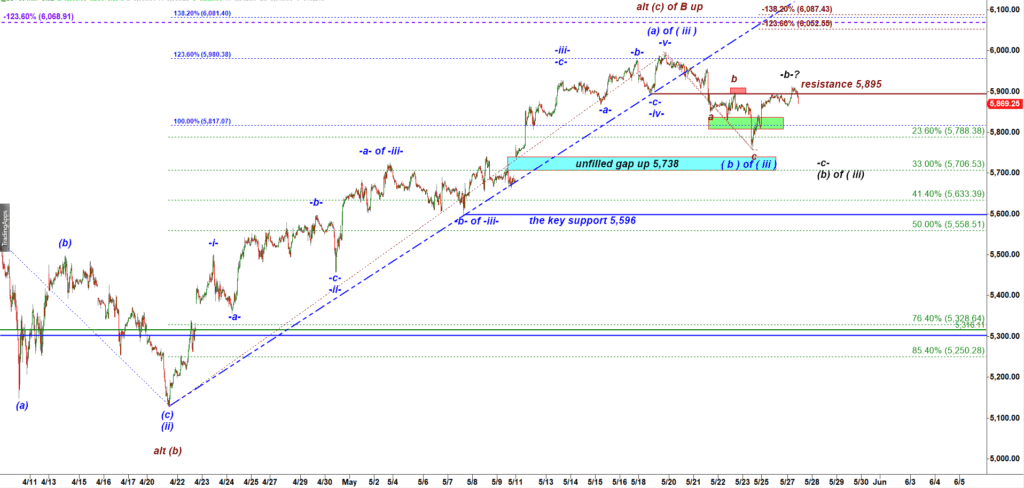
The bullish scenario assumes that the low made in early April was the bottom of a corrective pullback. Based on that assumption the bullish scenario argues for another five wave up rally targeting the new all time high. We can count that unfolding move up as an impulsive five wave up structure. We can count waves (i) up, (ii) down, (a) of ( iii ) up. Last week we got an a-b-c down pullback that could be counted as a subwave -a- down of (b) of ( iii ) of all of (b) of ( iii ).
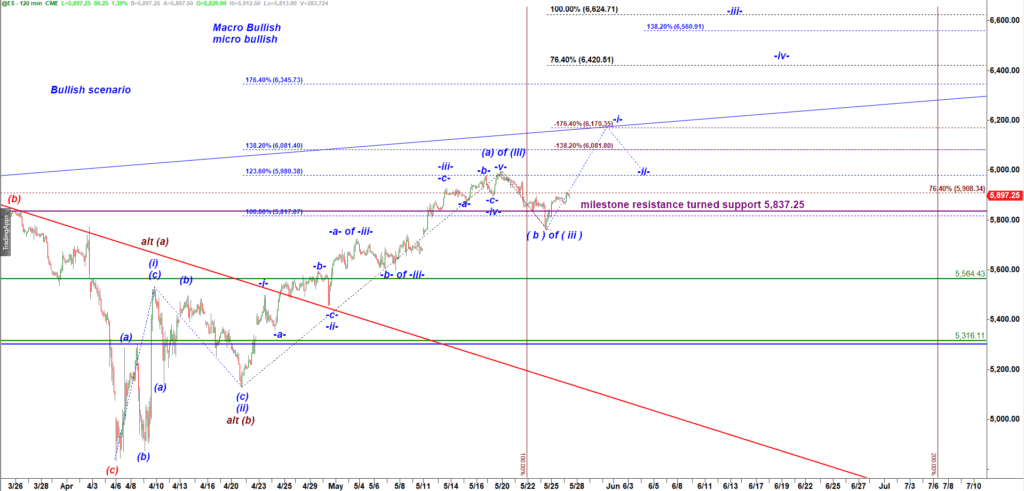
ES-mini 120 min chart
The core principle of applying Elliott Wave theory in trading is recognizing familiar, repeating patterns in price action. Once we identify which wave structure is currently unfolding, we can project potential future moves by referencing how similar patterns have played out in the past. This pattern-based approach helps us anticipate key turning points and plan trades with greater confidence and context.
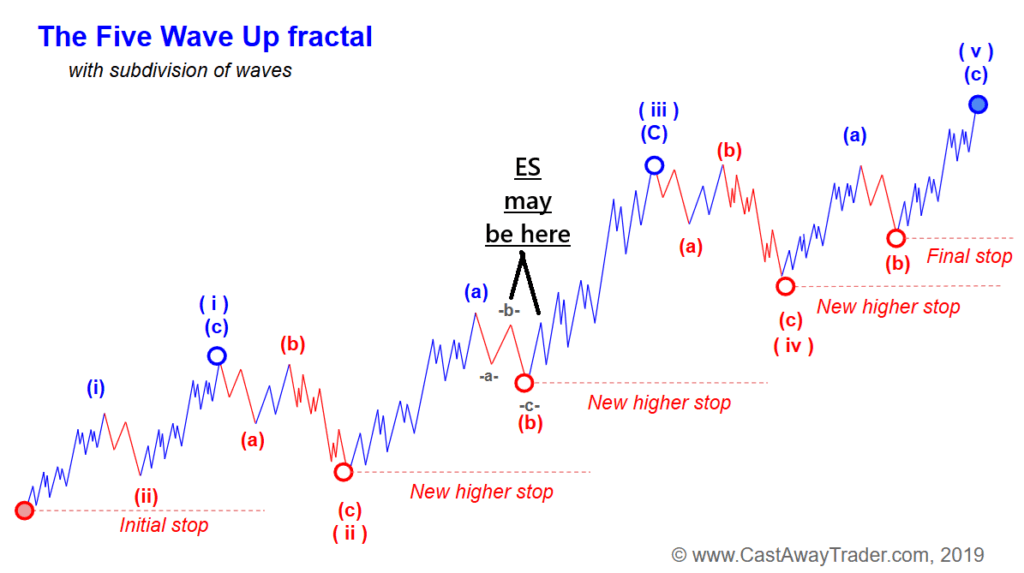
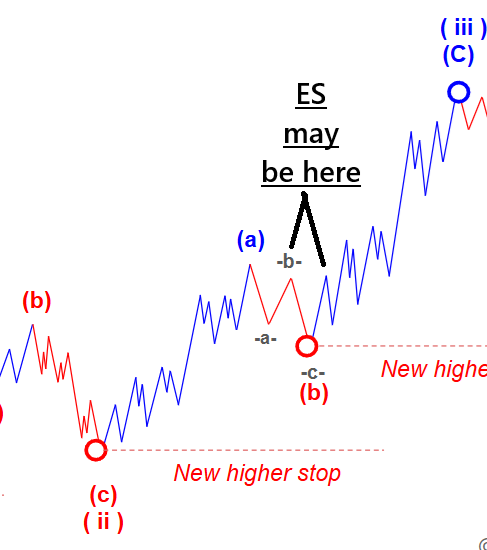
Every chart analysis begins with a working assumption: we estimate where the current price is located within a known fractal structure—whether it’s a motive wave rally or a corrective retracement. In the example above, we use the Five Wave Up Fractal (typical path of a trending move up) as our model. By comparing current price action to this idealized structure, we try to determine whether the market is in a trending impulse (waves 1, 3, or 5) or within a corrective phase (waves 2 or 4). In this case, we hypothesize that ES may be either in the middle of a corrective subwave (b), which is part of a larger wave (ii) or (iv) pullback or (ii) has just competed the subwave (b) down and has started a new leg up in the subwave (c) of wave ( iii ) up.
Let’s zoom-in to a 15 min chart:
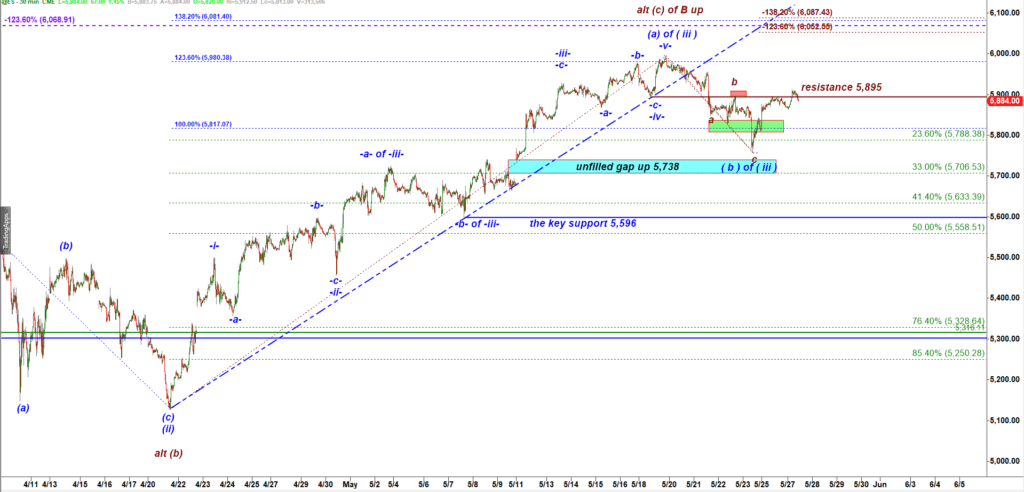
ES-mini 15 min chart
Off the Friday morning low, ES formed a micro five-wave up structure and broke through the 5,895 resistance level. This is an encouraging initial sign for the bulls.
According to classic Elliott Wave theory, a five-wave rally off a potential low is typically viewed as the first confirmation that a pullback may have ended and a new rally is underway. However, based on my experience, I remain cautious. Corrective subwaves—particularly wave -b- up—can often mimic a clean five-wave structure, creating a false sense of trend reversal. For that reason, I don’t consider this pattern alone to be a highly reliable confirmation of a completed correction. Further price action is needed to validate the bullish case.
What I mean is that we still can not be sure if the whole subwave (b) down was completed on Fri morning or that was the subwave -a- down and therefore this rally during the weekend completed the subwave -b- up:
ES-mini 15 min chart
Bears should attempt to start a subwave -c- down here. And they are trying to push ES down.
If they fail and price comes back up over 5,895 that would be a decent confirmation that the wave (b) of ( iii ) down bottomed on Fri morning and we should NOT expect another leg down in a subwave -c- of (b) of ( iii ).
As always, we look for one party to fail.
Because the best trigger of a rally is failure of bears to deliver decline allowed by a bearish wave count.
Micro Levels to watch (calculated and drawn by the Cycle Trader indicator for TradingView):
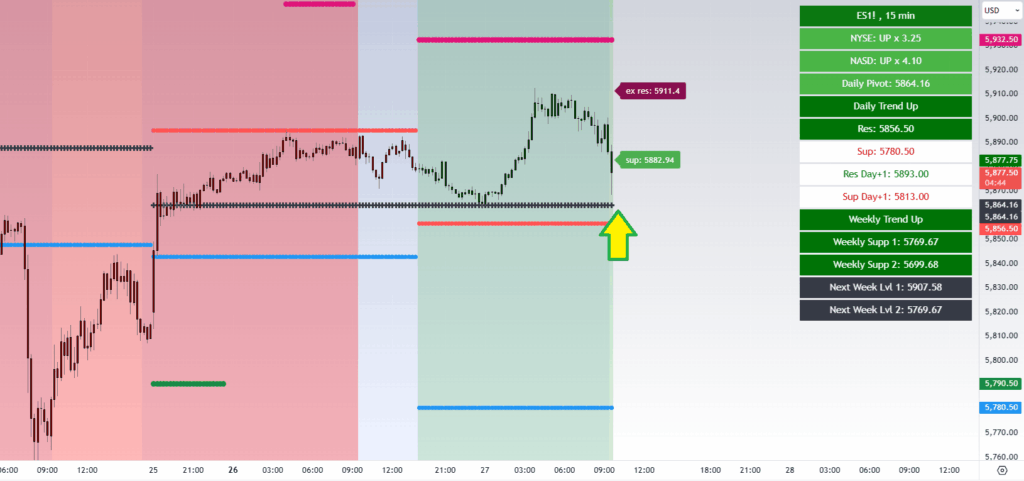
Check ES has tested the black Daily pivot 5,864.25.
This is an immediate support for now. The next support is the red broken Daily resistance 5,856.50.
The Daily trend is UP.