#ES #Elliott Wave #trading signals
Yesterday I concluded my afternoon update with bearish prediction:
“Bulls produced an overlapping textbook corrective three wave bounce. We can count it as a completed corrective wave -b- up.
Now bears have a decent short setup to ride a wave -c- down.”
I recommend you to join my Telegram channel to get instant notifications on all the updates I post on the web site.
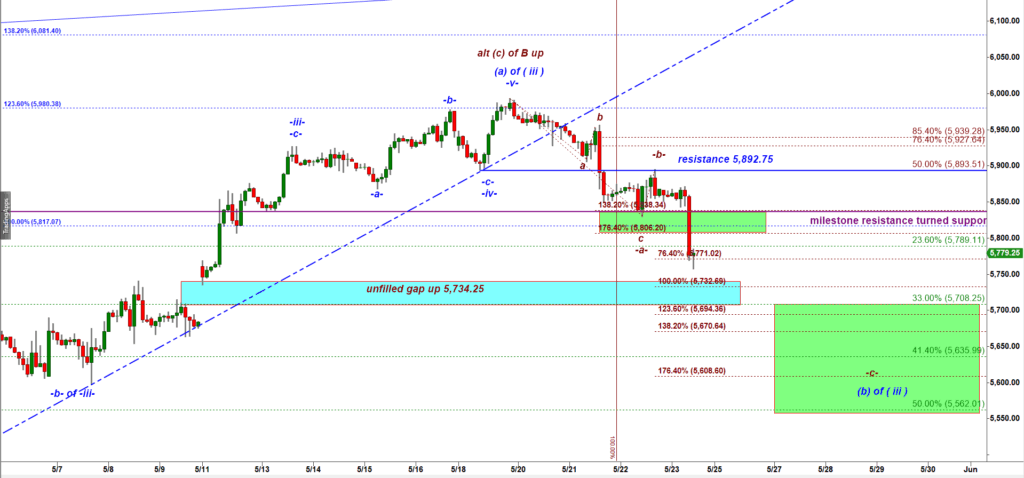
ES-mini 120 min chart
ES took a dive as we expected. But that drop has not tagged my targets yet. The target 1 is the upped edge of the unfilled gap up (see the cyan box) = 5,734.25. The nearest micro support is the secondary daily support 5,739.25.
Ideal scenario is the drop extends down to 5,708 level. I like that level for three reasons:
(1) its a 33.3% retracement of teh latest five wave up rally, and
(2) this is where price needs to go to fill teh cyan box of teh unfilled gap, and
(3) it would re-test the peak made on May 2nd.
It may even undershoot that level down to 5,694 to tag the 123.6% of the wave -a- down.
I will have to drop my bearish expectation for lower lows if bulls manage to reclaim 5,837.25 resistance. That move up would be the first confirmation that a shallow pullback got completed and a new wave up has started.