$SPX #Macro #Weekend
The S&P 500 cash index and the E-mini S&P 500 futures (ES-mini) track the same benchmark—the S&P 500—but they differ in how they are used and traded.
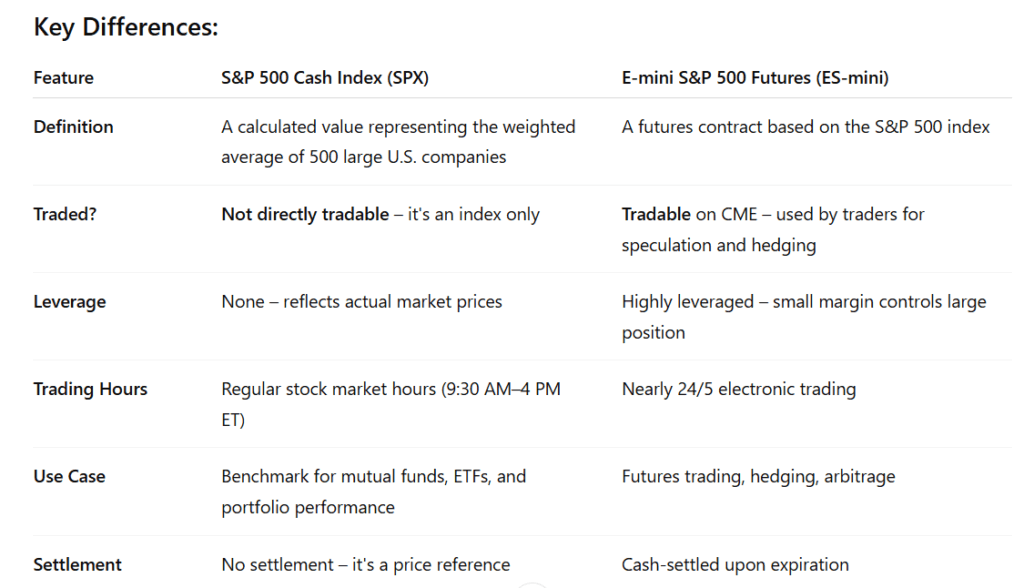
Analyzing Elliott Wave counts on both the S&P 500 cash index (SPX) and the E-mini S&P 500 futures (ES-mini) is valuable because each instrument provides unique and complementary insights:
🔄 1. Slightly Different Price Structures
- Cash index (SPX) reflects the actual spot prices during regular trading hours.
- ES-mini trades almost 24 hours, capturing overnight sentiment, global macro reactions, and extended volatility.
- Result: The two instruments can show subtle differences in wave structure, gaps, or intraday highs/lows—sometimes a wave count is clearer on one chart than the other.
🕒 2. Broader Market Context vs. Trading Sentiment
- SPX shows the broader investor sentiment during U.S. trading hours, useful for long-term counts.
- ES-mini reveals trading sentiment, liquidity shifts, and market reactions to news outside regular hours—key for refining short-term wave counts.
📊 3. Confirmation and Validation
- A wave count seen on both instruments—especially if key levels align—adds confidence to the analysis.
- If one shows a complete 5-wave move while the other doesn’t, it may signal incomplete structure or divergence worth trading or avoiding.
🧠 4. Trading Decisions vs. Forecasting
- Use SPX for strategic, big-picture analysis (especially daily/weekly timeframes).
- Use ES-mini for execution and tactical entry/exit, especially if trading futures or looking at intraday setups.
✅ Conclusion:
By comparing both SPX and ES-mini Elliott Wave counts, you get a more complete, time-aware, and nuanced view of market structure—helping improve both your forecast accuracy and trade timing.
So today we are looking at the cash index S&P 500 that is not traded but has direct impact on ES-mini and SPY ETF:
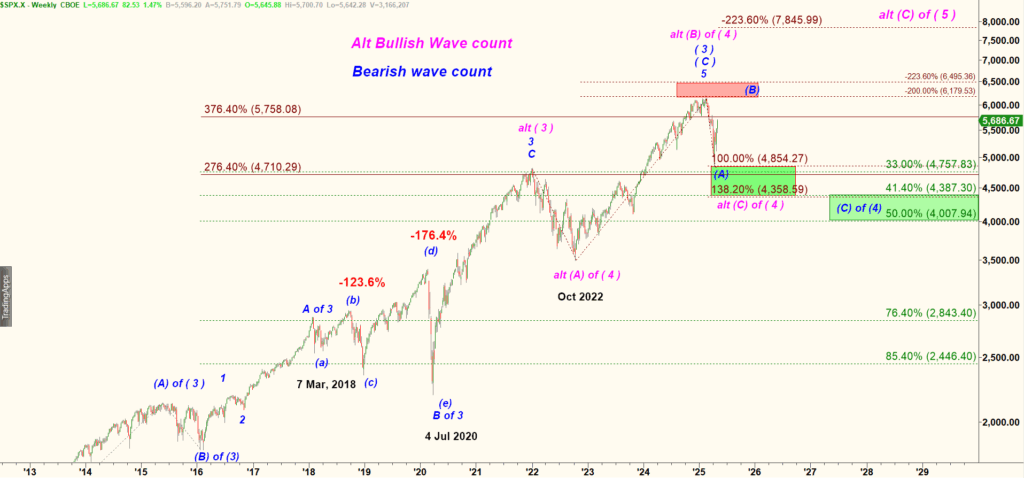
S&P 500 weekly chart
I think S&P 500 most likely has completed a five wave up structure of the rally in a subwave (C) of wave ( 3 ) up off early 2016 low. When a five wave up structure gets completed we expect a three wave declien, a textbook A-B-C down structure of combination of two or three (a)-(b)-(c)’s.
Let’s zoom-in to a 240 min chart:
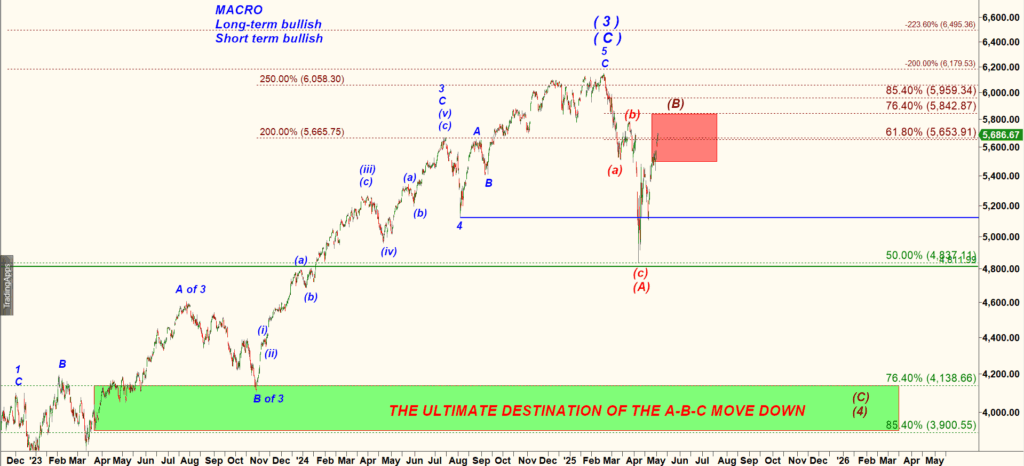
S&P 500 240 min chart
According to that wave count, this rally is a corrective wave (B) up to be followed by another wave (C) down. The problem is that waves (B) up (in direction of the main trend are very tricky beasts to trade). After completion of the first leg down in a wave (A), bulls feel confident its yet another “buy-the-low” opportunity. They consider a swift bullish reaction as vindication of their conviction. However, a swift reaction is a direct result of their conviction.
Let’s zoom in to a 30 min chart:
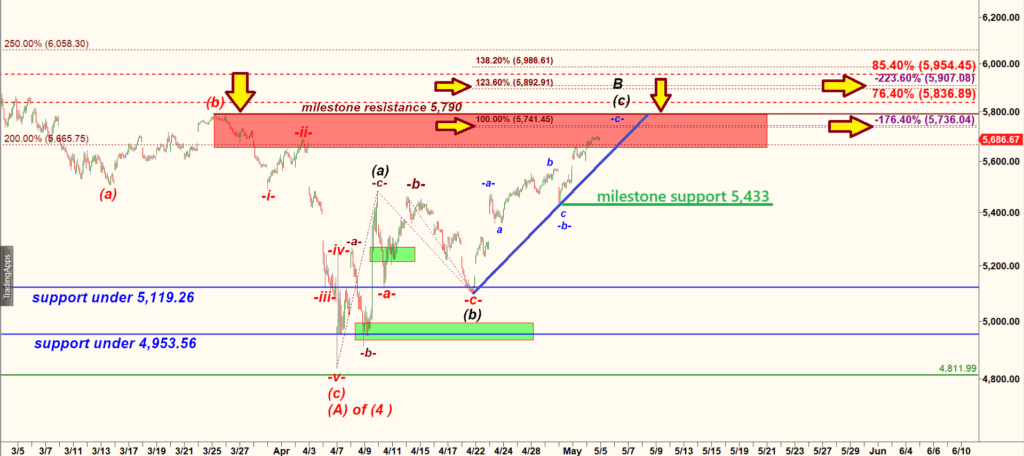
S&P 500 index
S&P is approaching a strong milestone resistance level = 5,790.
Note that the Natural Year Opening Range peaked at 5,786.95. That is the Year 2025 resistance.
But before it can go that high and tests that level, bulls need to break over a decent cluster of two extensions that create a resistance at 5,736 – 5,741.
We can easily get this whole (a) up, (b) down, (c) up move to to somewhere in between of 5,736 and 5,790. But it is not guaranteed.
 When anticipating the top of the final subwave C up in a Double Three corrective structure, it’s essential to be prepared for a potential blow-off top driven by FOMO (fear of missing out) sentiment. This final surge often lures in retail traders, who become convinced that the move is not just a corrective bounce, but the beginning of a new bullish rally. Ironically, it’s this late-stage optimism that frequently marks the end of the move.
This is why its fairly difficult if possible to predict the exact topping point. As always, a much more reliable short setup would be a failed breakout. For instance, watch tht milestone 5,786.95 resistance. If bulls manage to overshoot it but then bears quickly retake control and push price back under the resistance that would be a great shorting opportunity.