$COMPX #Head and shoulders
🧠 Understanding the Instruments: Nasdaq Composite vs. NQ-mini Futures
Before diving into the wave count and forecast, let’s quickly clarify the difference between two key instruments many traders watch:
- Nasdaq Composite Index: A broad index tracking the performance of over 3,000 Nasdaq-listed stocks, including giants like Apple, Microsoft, and Amazon. It reflects overall market sentiment and includes all sectors.
- NQ-mini Futures (also known as E-mini Nasdaq-100, ticker: /NQ): A futures contract tracking the Nasdaq-100 index, which includes the 100 largest non-financial Nasdaq-listed companies. It’s widely used for leveraged trading, especially outside regular market hours.
📉 Elliott Wave Count & Macro View
I am currently counting the December 2024 high as the top of a large wave (3) up. The April 2025 decline reached a textbook 33.35% retracement of the previous five-wave rally off the 2016 low, which likely completed wave (A) down.
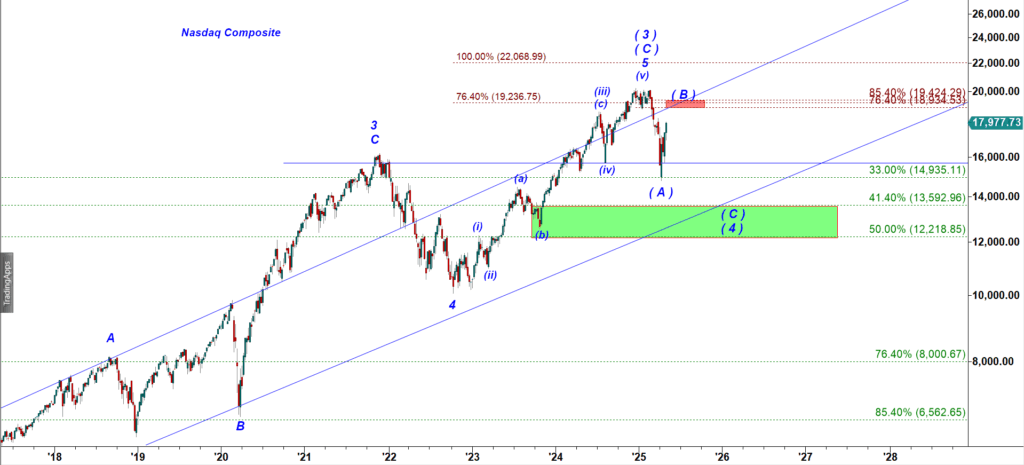
Nasdaq Composite, Weekly chart
The subsequent bounce is being counted as corrective wave (B) up, which I expect to be followed by another leg down in wave (C) of (4). The target zone lies within or near the Green Box support area on the chart.
📊 Near-Term Resistance Levels (120-min Chart – COMPX)
The Nasdaq Composite is now approaching a cluster of resistance at 18,300–18,400.
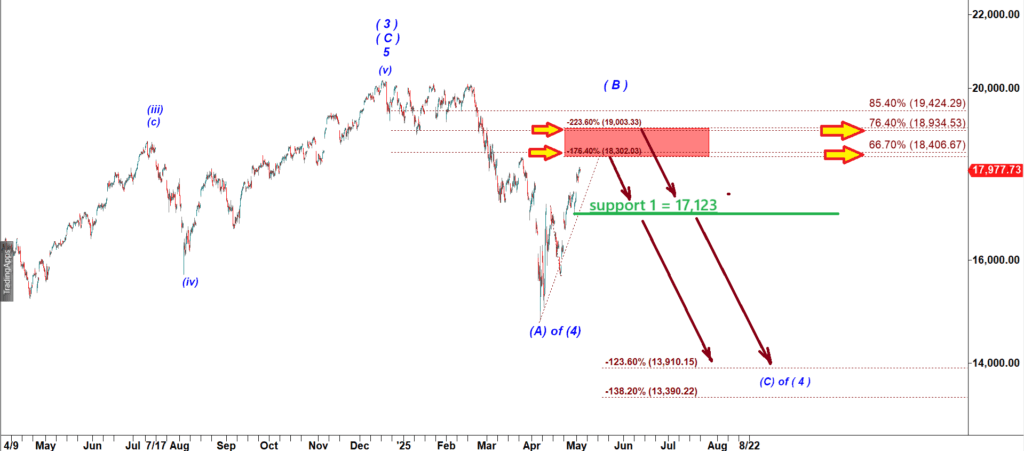
Nasdaq Composite 120 min chart
- If bulls manage to break above and successfully retest this zone, the rally could extend to the next resistance area at 18,900–19,000.
- However, I expect the bulls to fail at one of these levels, both of which align with the boundaries of the Red Target Box.
Should that happen, the most bearish scenario calls for a large leg lower, potentially leading to new year-to-date lows.
⚠️ Key Support to Watch: 17,100
This level acts as Support 1 and represents a potential decision point. If broken, it opens the door to a deeper correction. If it holds, it may invalidate the bearish case.
🔻 Head & Shoulders Macro Pattern (Bearish Setup)
Traders using traditional technical analysis may recognize a potential Head and Shoulders reversal pattern forming:
- Left Shoulder High: 18,670
- Neckline: 15,700
- Right Shoulder: Currently developing
Plan A – Bearish Reversal:
- Completion of the right shoulder
- Reversal down
- Test and break of the neckline at 15,700
→ This would confirm a macro top and a deeper corrective wave (C)
Plan B – Bullish Invalidation:
- Right shoulder completes
- Reversal down
- Drop to 17,100 support
- Bears fail to break that level
- A bullish reversal follows
- Index breaks above the right shoulder high
→ This would invalidate the Head and Shoulders and signal the start of a new all-time high run
🎯 Final Note:
We are at a critical juncture. The next few sessions will help determine whether this is a bearish topping pattern or simply a pause before a breakout. Keep a close eye on 17,100 support and 18,400 resistance—they’ll likely tell the story.
For NQ-mini future the key resistance is 20,524.75. That is the Year 2025 Resistance.