$ES #ES-mini #bullish reversal
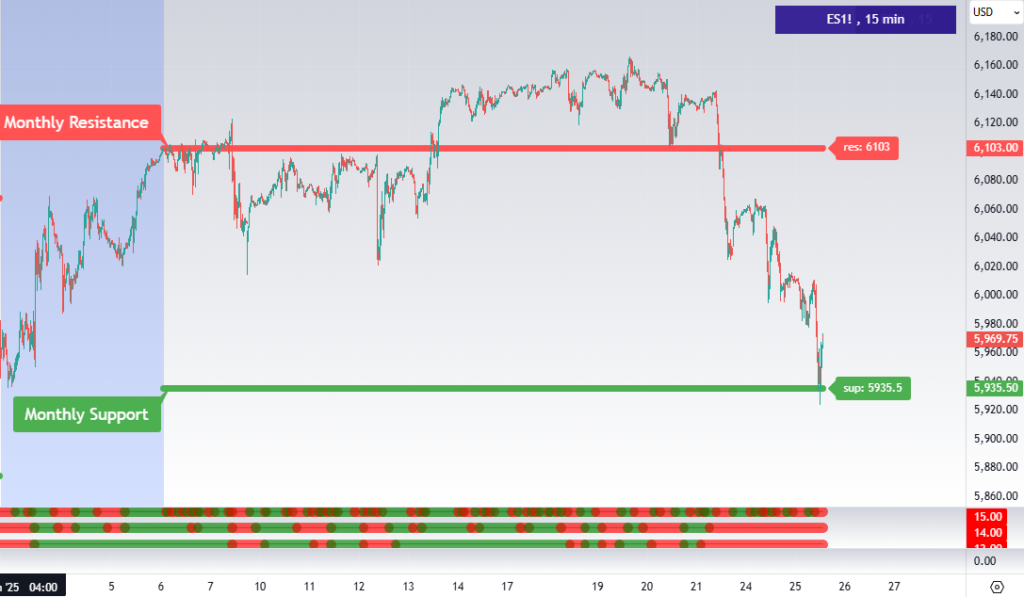
The green demand zone 5,994 – 6,.000 got broken yesterday:
ES-mini 120 min chart
Note that Tuesday decline stopped right at the Support of the Month of February = 5,935.50
You can find that indicator here.
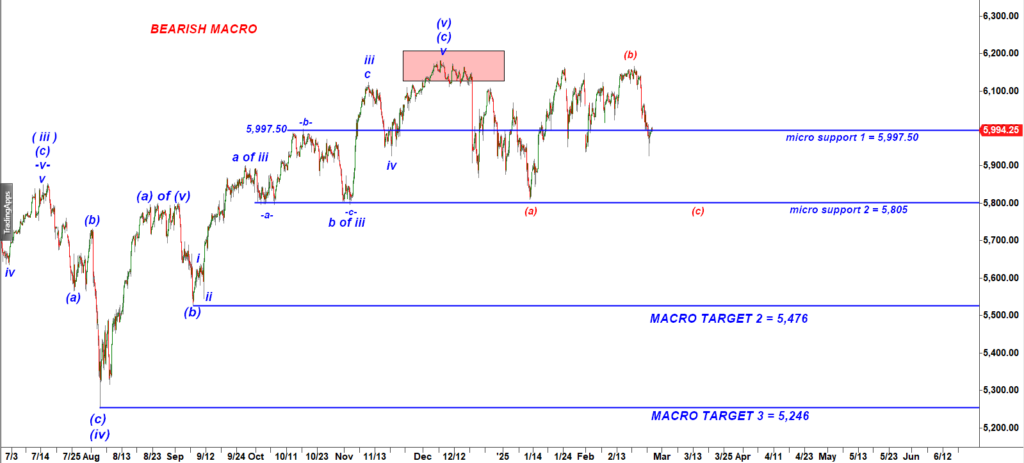
Under the bearish scenario, If bulls fail to reclaim 6,000 we should get a new leg down to 5,800.
Now we have to discuss what can happen if bulls manage to reclaim the 6,000 level, let’s see what kind of a scenario that bulls are dreaming about.
The Bullish scenario:
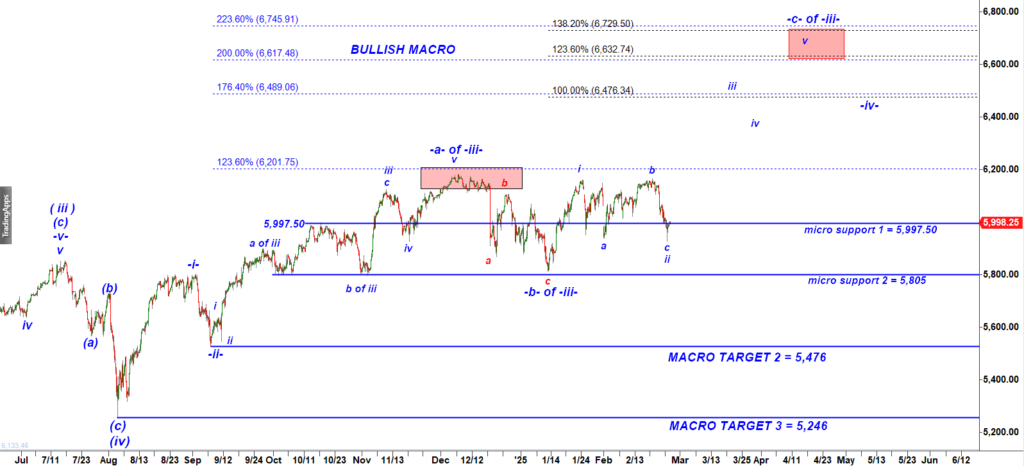
ES-mini 120 min chart
Bulls count the Tuesday drop as a s subwave c of wave ii down. That means bulls try to start a big rally in a wave iii of -c- of -iii- up targeting 6,470.
This is how the bullish scenario looks on a micro level:
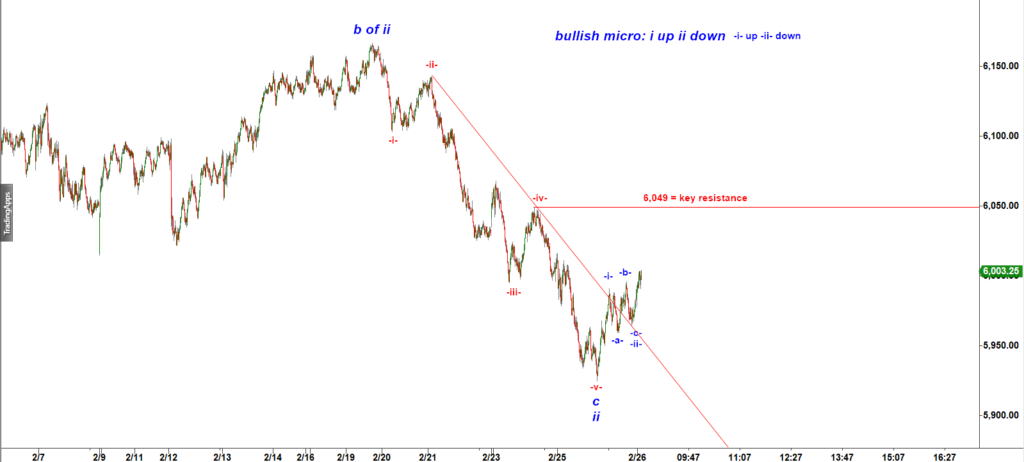
ES-mini tick bar chart
Based on two alternatives here there are two alternative trading plans for this morning:
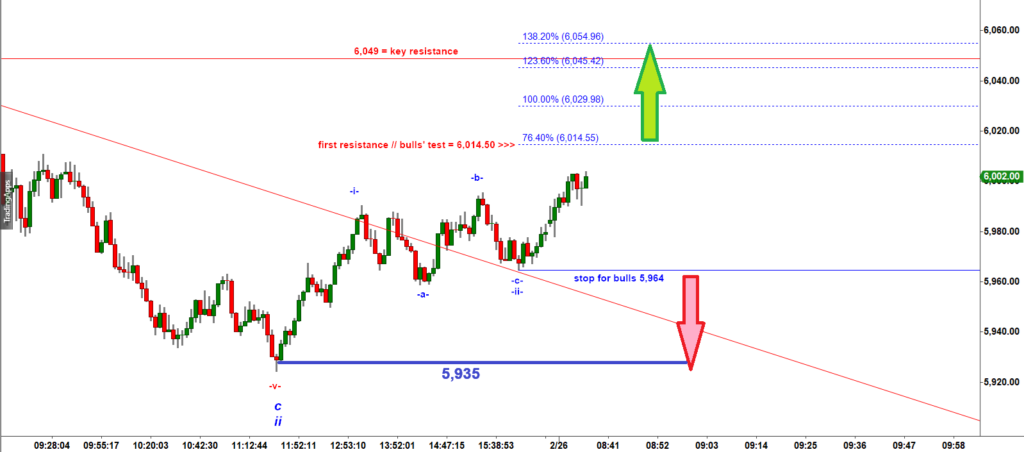
I would wait for bulls to break over 6,014.50 to confirm that we deal with a starting impulsive rally.
Bears need to wait for the immediate support 5,964 support to get broken.
MORNING 10:30 AM EST UPDATE
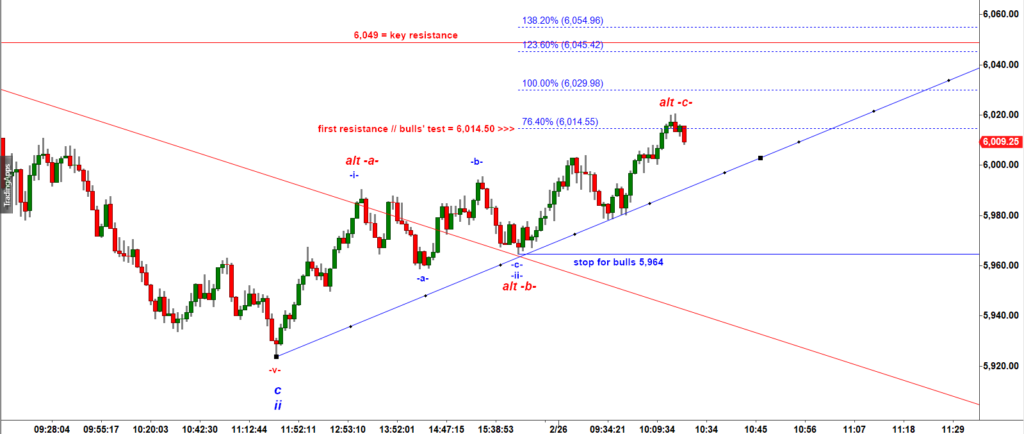
ES-mini tick bar chart
Note that bears may count that -a-b-c- move up as a corrective pullback that hit the test resistance level = 6,015. Bears have to defend that level to set the stage for another decline.