#tradingsetup #Elliott Wave $ES #ES-mini
There are two important resistance lines – 5,871.50 and (6,000.50 – 6,011.50):
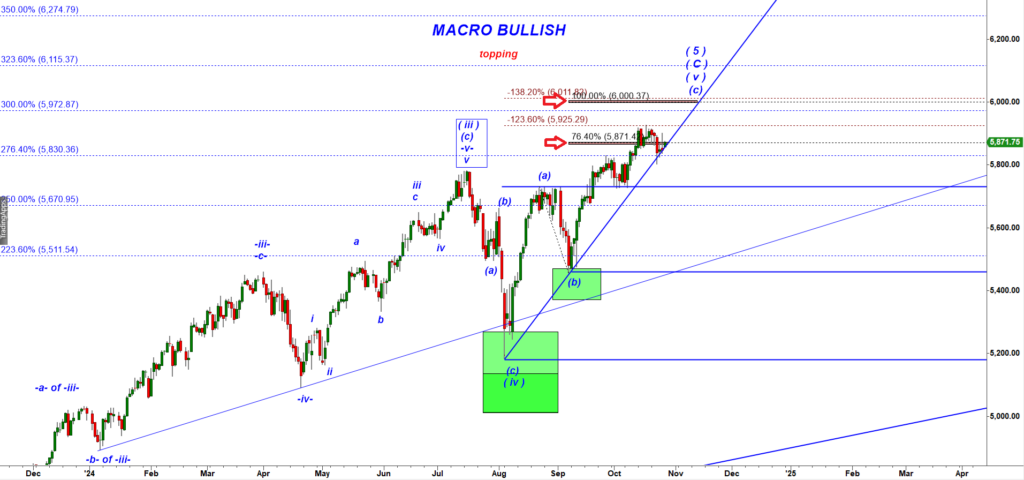
Es-mini Daily chart
5,871 level turned into a battleground between bulls and bears.
If bulls fail to climb over the resistance 5,871.50 we can expect a drop down to the support 2 = 5,730.50:
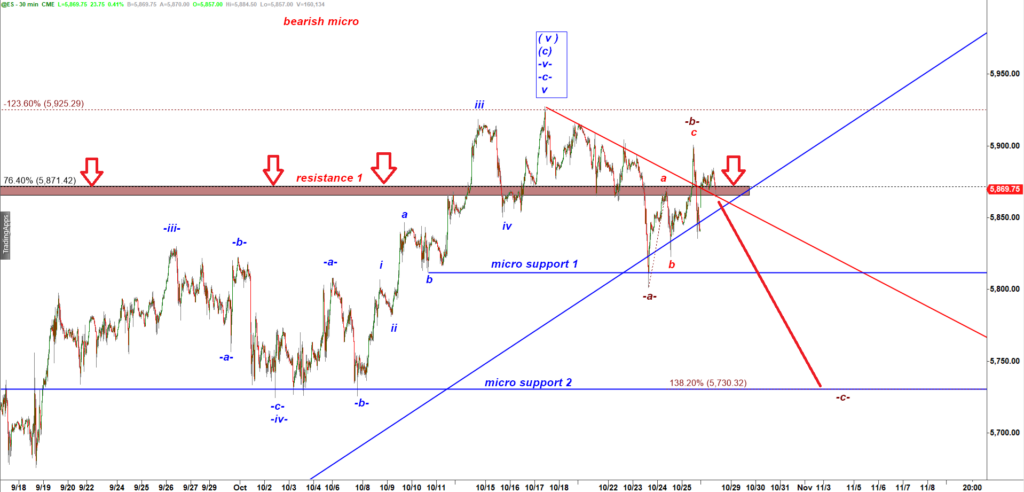
ES-mini 30 min chart
On a micro level the immediate support to get broken is 5,857.75:
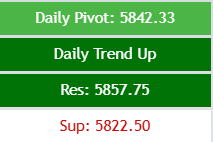
The levels are calculated by my proprietary Cycle Trader indicator for every day.