$SPX $S&P #Elliott Wave #trading setup
SPX has finally hit 5,881.50, a negative 138.2% ext applied to the preceding move down (July – Aug 2024 pullback):
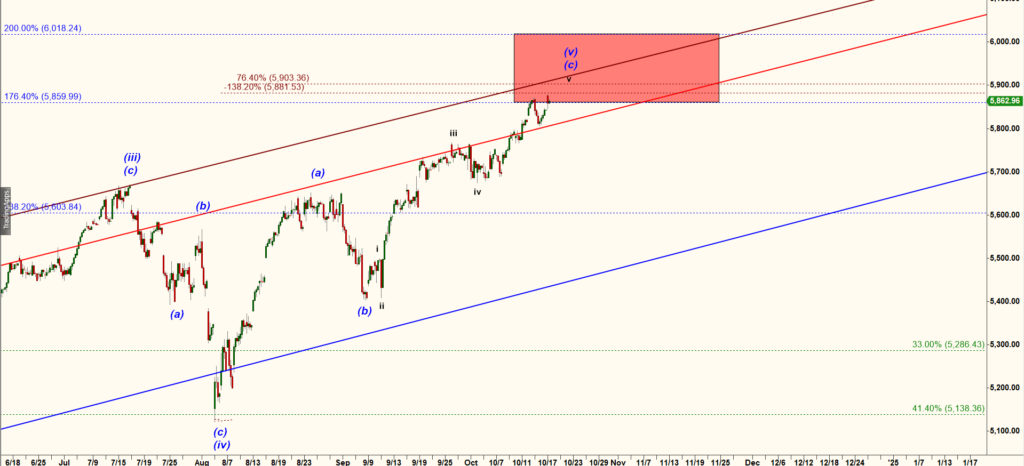
S&P 500 Cash Index, 120 min chart
Bulls can squeeze one more push higher to hit the upper dark red trendline (around 5,903). But this move up looks 99% done.L
Let’s look at a micro chart of Es-mini:
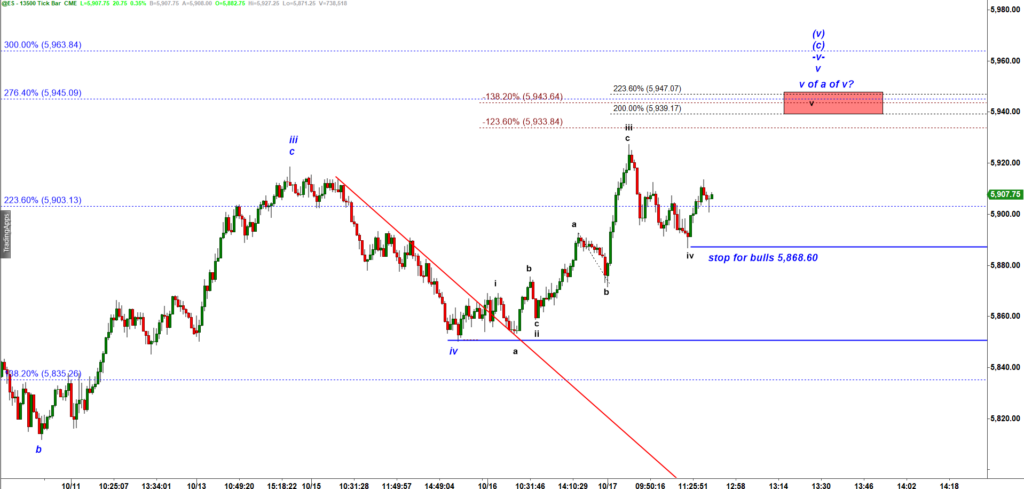
ES-mini 13,500 tick bar chart
We can set a new stop for long positions under the morning low 5,868.50.
Bulls still have room for one more push higher towards 5,943.50 (ES mini Dec’24 contract).