$ES #ES-mini #trading setup #Elliott Wave
On Thursday morning we got an exhaustive panic driven spike powered by CPI data release:

In this update I will discuss two wave counts.
The first one is the bearish count that argues ES-mini made a lasting top. Let me explain you why I do not like that count.
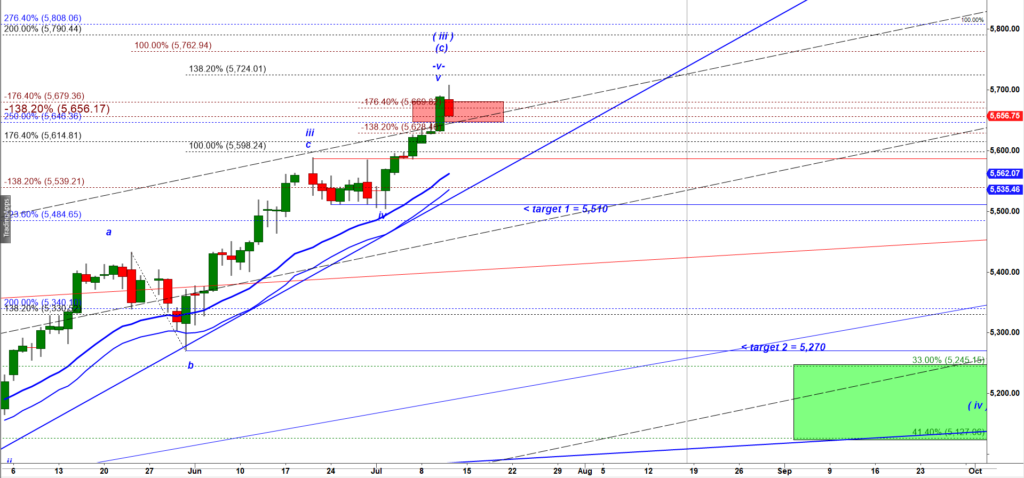
The main problem with that bearish wave count is a lack of an a-b-c subdivision in the wave (iv) down.
When we see a straight line drop after an accelerated rally more often than not its a wave iv of one degree lower, specifically -iv- of (c) of ( iii ) up. Typically, the wave (iv) has a clean (a)-(b)-(c) subdivisions.
In addition, if wave 3 tops at 200% ext of wave 1 we normally expect the wave 5 p to stretch at least up t0 276.4% ext or even 300% ext.
In addition, if wave 3 tops at 200% ext of wave 1 we normally expect the wave 5 p to stretch at least up to 276.4% ext or even 300% ext. So far the rally stopped at 250% ext of the wave (i) up.
Those two observations make me consider the bearish scenario as an alternative scenario and favor the Very Bullish scenario.
The Very Bullish scenario:
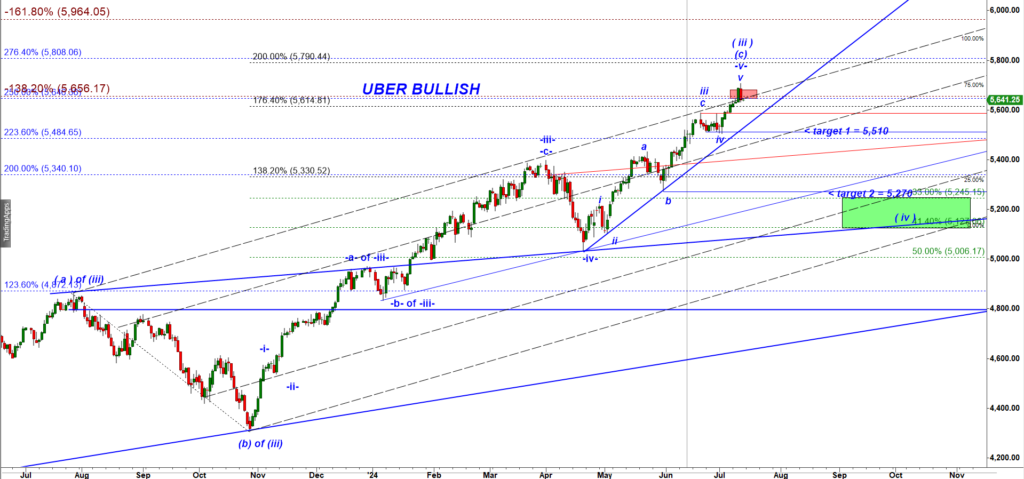
The Uber Bullish count argues that only the wave ( iii ) up of the rally that started in Oct 2022 has topped. That count argues we should expect a relatively large corrective wave (iv) down.
When I expect a wave 4 down this is how I look for potential targets of two legs down:
(i) I expect a three wave (a) down, (b) up, (c) down structure, and
(ii) I expect the first leg down to bottom at 33.3% or 41.4% retracement of the last completed five wave up structure, and
(iii) I expect the second leg down in a subwave (c) of wave (iv) down to possible bottom at 33.3% or 41.4% of the preceding five wave up structure of one degree higher.
Let’s me show you first the last completed five wave up structure:
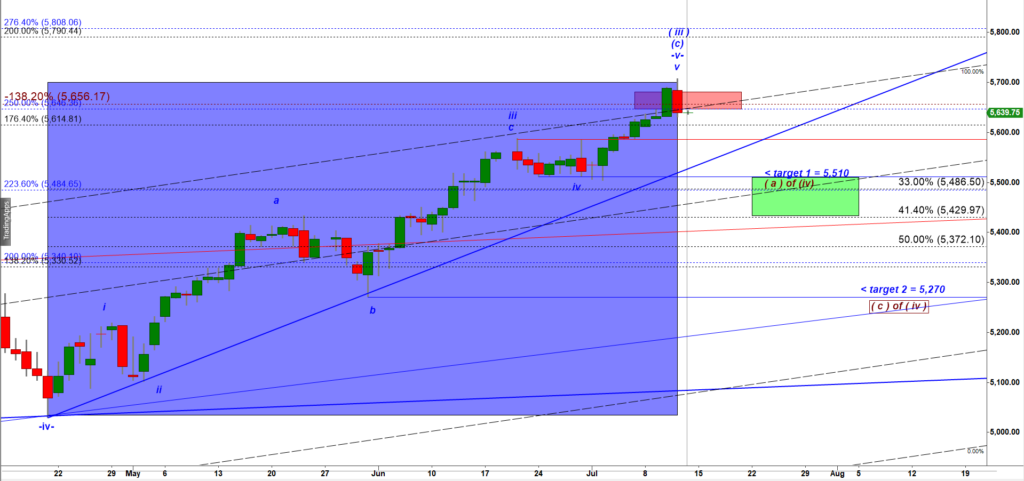
We can see a cluster formed by a 33.3% retracement = 5,486.50 and the low of a micro wave iv down which is the natural target for the very first leg down.
Now let me show the completed five wave up structure on one degree higher (see a larger box with green border):
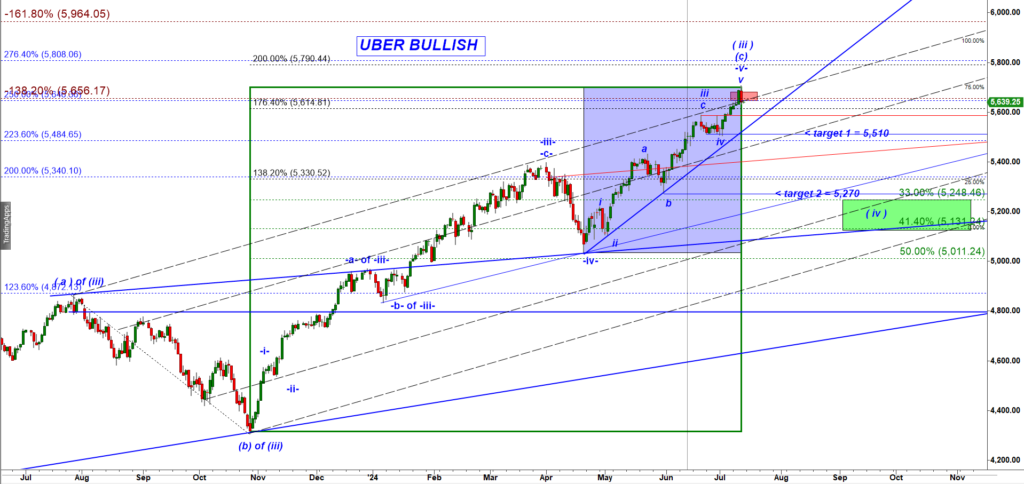
If we apply retracement fibs to that larger structure that also looks completed, we will get two potential targets for the second leg down in a subwave (c) of wave (iv) down:
- 33.3% retracement = 5,248, which forms a cluster with the low made by a subwave b down of a wave iii up = 5,270, and
- 41.4% retracement = 5,131.
In conclusion, even under the Uber Bullish scenario, if the wave (iii) up topped today then bears have a lot of room to push ES down until they hit the first meaningful support around 5,510 – 5,486.