$ES #ES-mini #trading setup #Elliott Wave
I watch three potential macro scenarios and two micro scenarios. Let’s discuss them.
(1) the Uber Bullish Macro Path:
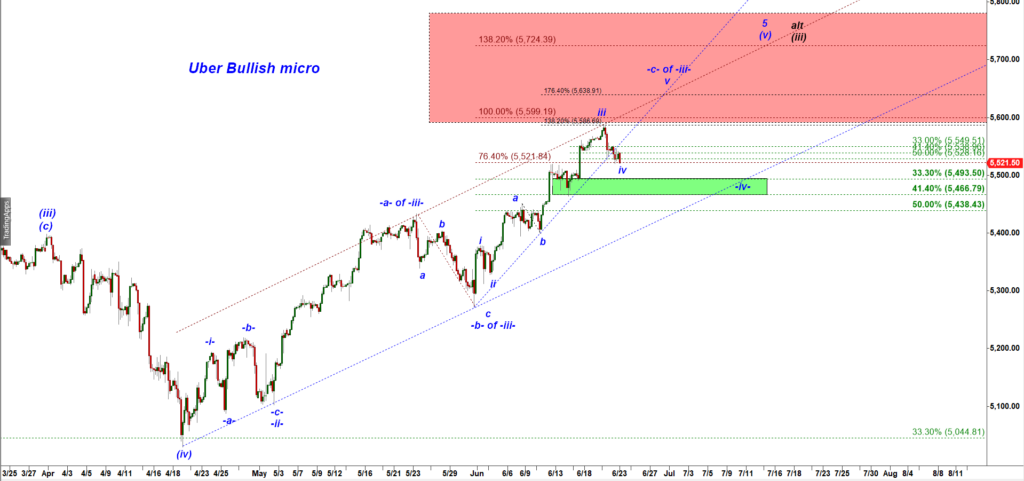
Note that 5,521 is the previous high, a resistance that is supposed to work as a support now. The Uber Bullish scenario considers that decline as a micro wave iv down, a monowave structureless decline that should be followed by another leg up to a new all time high.
(2) The Bullish / Daily chart
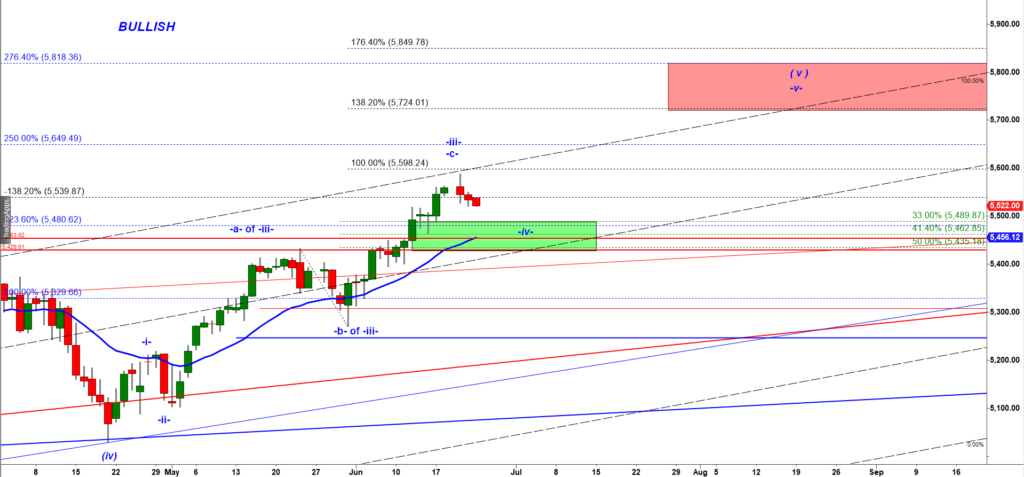
Under the normal bullish scenario ES topped in a micro wave -iii- up off the April 2024 low and can push higher one more time to tag the Red Box. The blue moving average is EMA 21 Daily, an important support for up trending stock. It points to 5,460. In addition, 5,462 is a 41.4% retracement of the last leg up, another standard target for a wave -iv- down.
I see two alternative micro paths that can lead ES-mini down to 5,460:
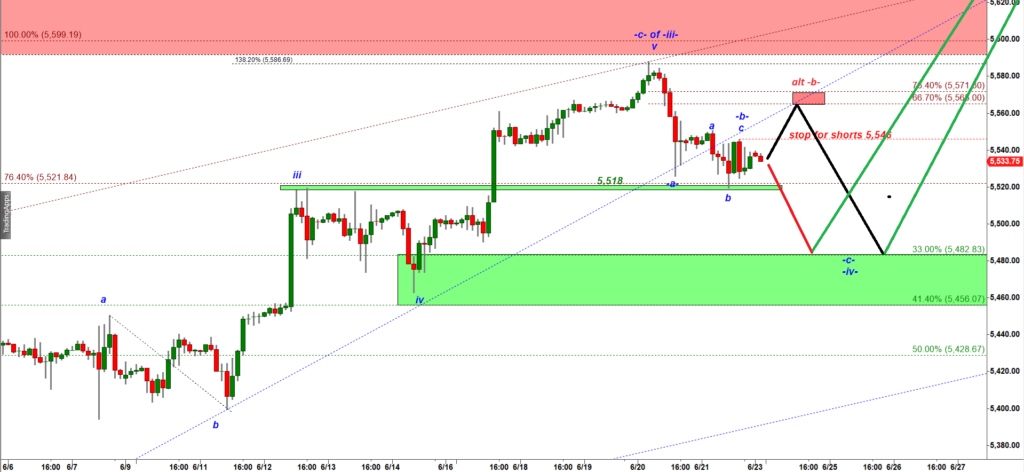
As long as bears hold ES-mini under 5,546 (tonight and on Monday) they can push ES down in one more leg down targeting the Green Demand zone.
Alternative macro path (teh black line on the 120 min chart shown above):
However, the low made at 5,519 on Friday morning can be counted as a bottom of the subwave -a- up and if bulls manage to push ES over 5,546 they will most likely be able to push ES up to 5,560-5,570 in as a wave -b- up. Both micro scenarios allow bears to test the Green Demand zone.
(3) The Bearish Macro Scenario.
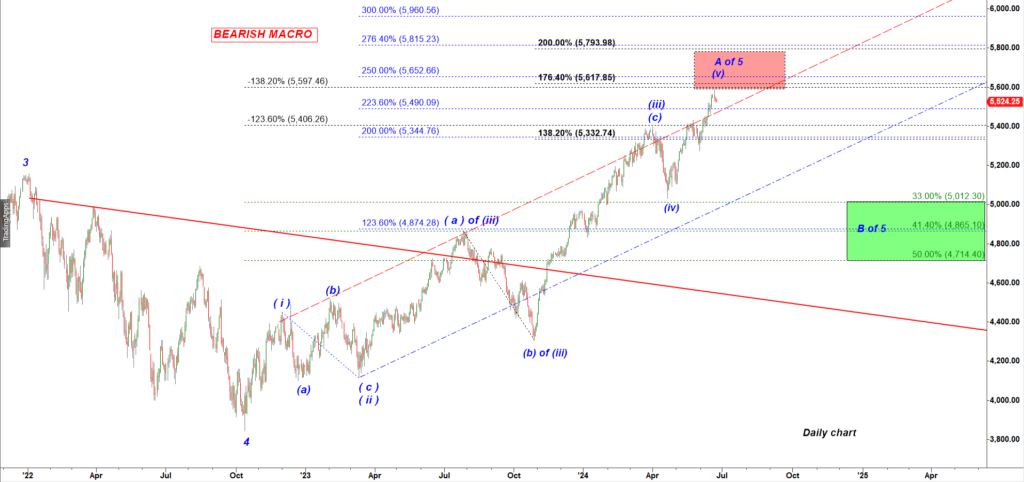
We can make a case that the whole five wave up rally off the Oct 2022 low topped or is about to top with one more push higher into the Red Box. Under that count we should expect a multi week A-B-C down flat structure that can erase 41.4% – 50% of the whole rally (see the Green Target box).
In conclusion: As long as bulls hold ES-mini over 5,460 we can favor the bullish scenarios shown above.
Last week I made available for subscribers my brand new indicator for TradingView called the Impulse Master that is damn good at picking tops and bottoms.
Interestingly it picked several tops in June 2024:
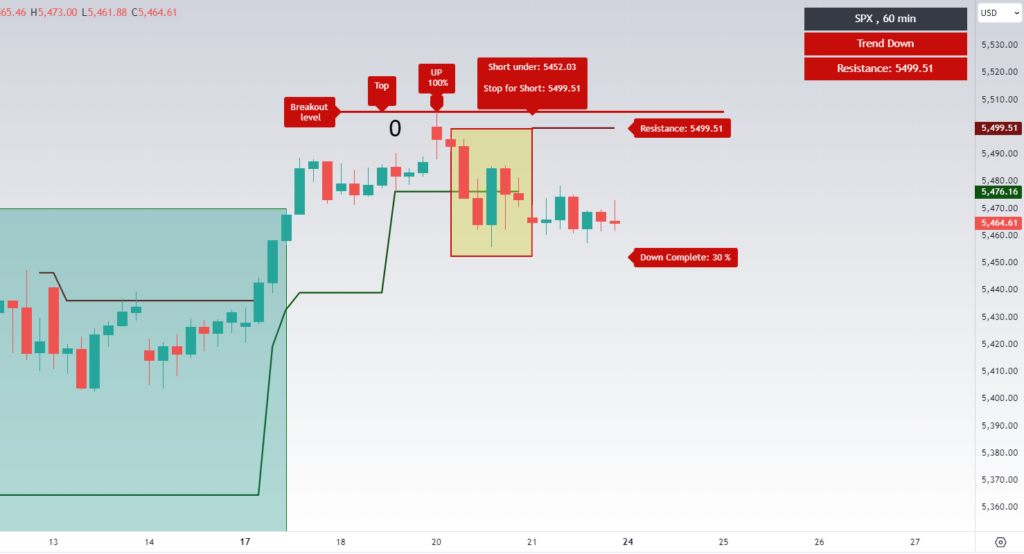
S&P cash index printed a topping signal on Jun 20, at the very top.
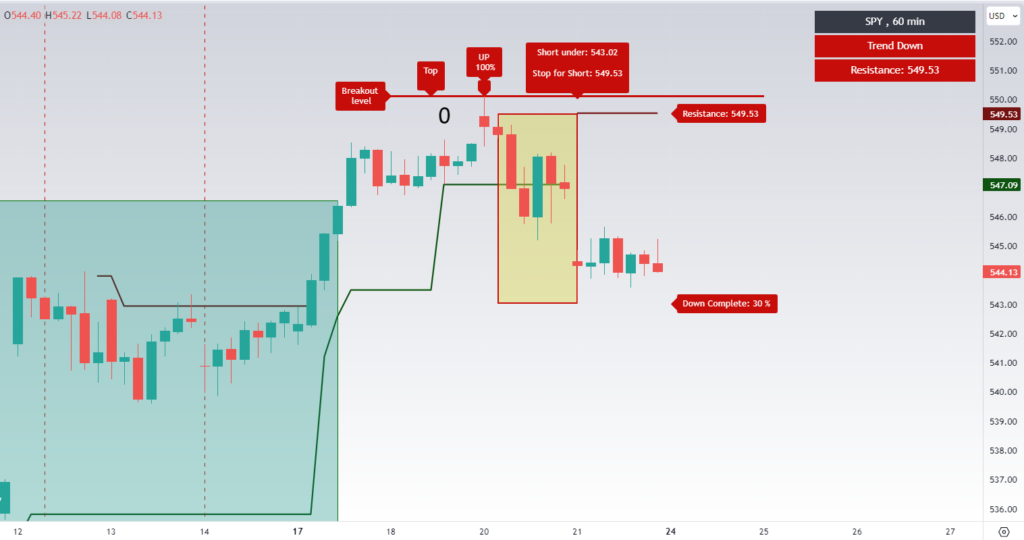
So did the SPY:
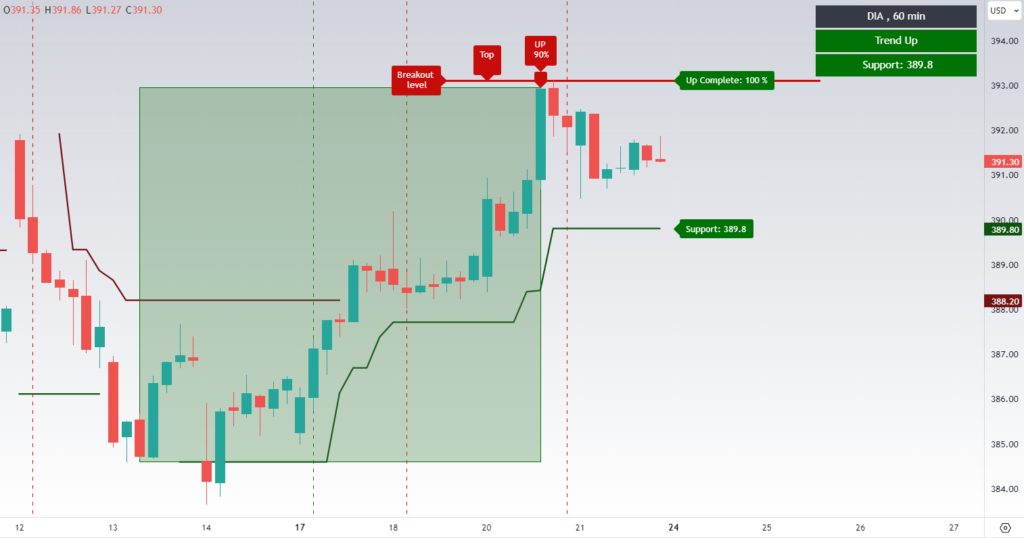
so did DIA (represents DOW Jones Industrial average):
Follow my second Twitter account where I post live signals.