$NQ #NQ #trading futures #tradig setup #Elliott Wave
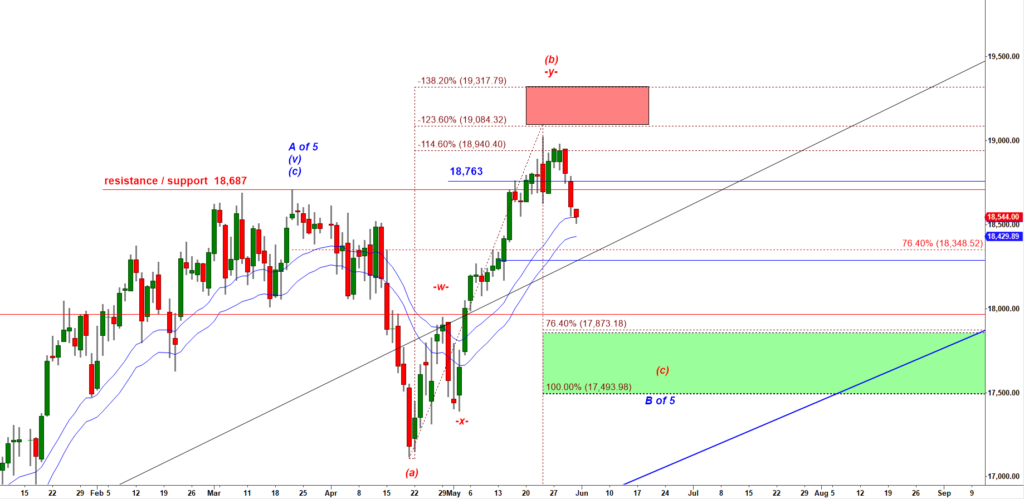
On the daily chart you can see that NQ-mini rolled over and started the second leg down in a wave (c) down:
Look at the Green Band formed by two EMA 21 lines:
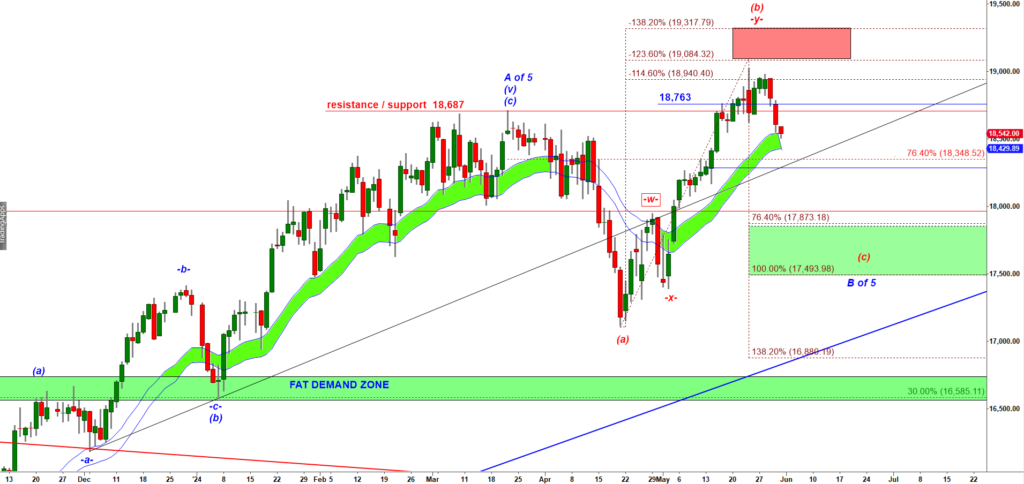
You can see on the chart that the green band stopped a number of bearish moves throughout 2024. We can expect it to act as support this time as well.
Let’s zoom-in to a 30 min chart:
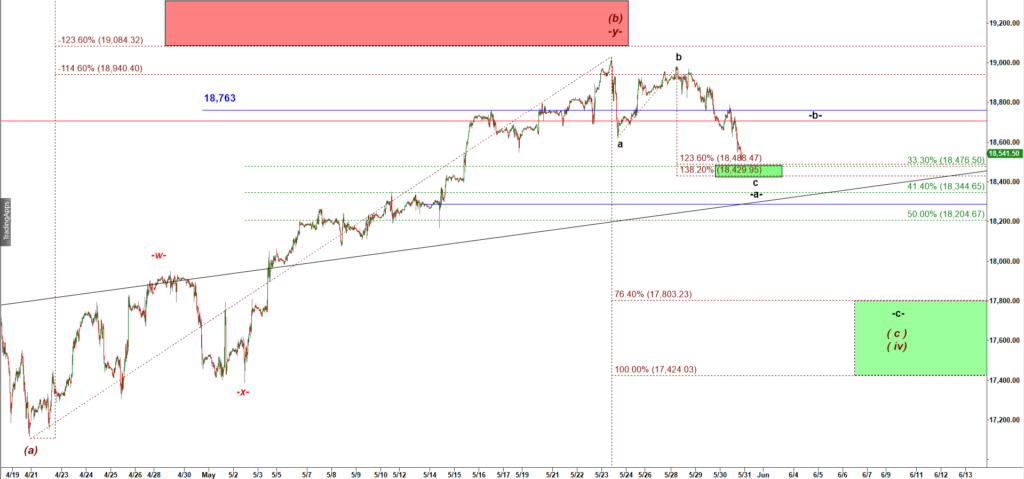
A strong support is located at 18,476 – 18,430. Note, the EMA 21 Daily calculated based on low price (the lower edge of teh green band shown on the daily chart) is located at 18,430. This is exactly where c down = 138.2% of a down, the golden extension for corrective a-b-c structures.
Tomorrow is the final day of the month of May. May has been rather bearish. Bears can finish the month on a bearish tone [tomorrow] that would create a stage for at least a 2-3 day bullish pullback during the first trading week of June [starting Monday] in a wave -b- up.