$ES #ES-mini #trading futures #trading setup #Elliott Wave
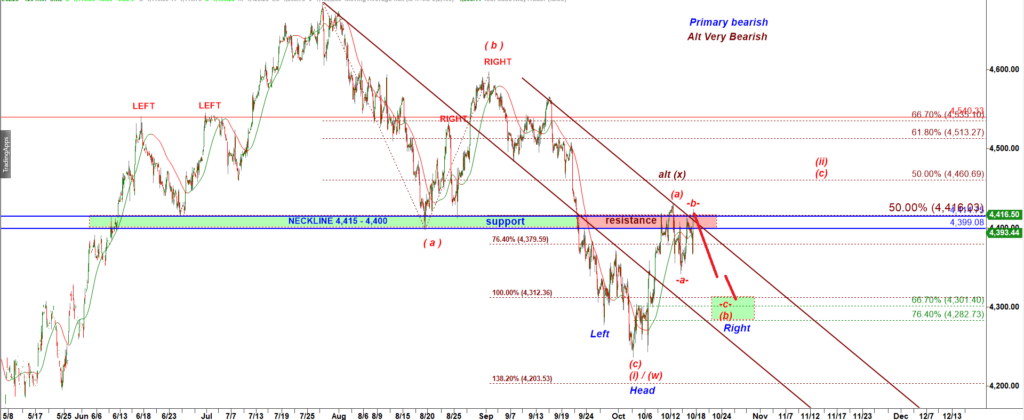
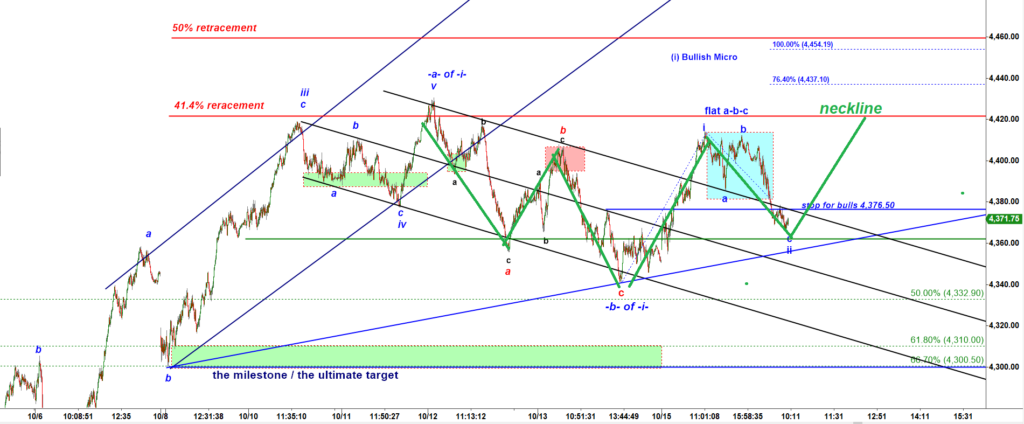
So far all what bears did is they produced a corrective flat a-b-c consolidation OVER the broken-resistance-turned-support:
A flat a-b-c consolidation OVER the broken-resistance-turned-support is a reliable continuation long trading setup.
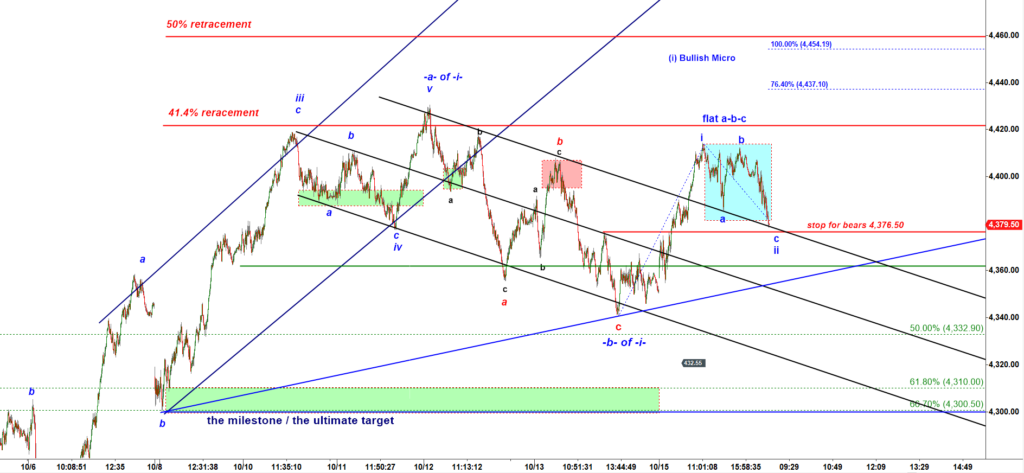
First, price is over 4,376, the breakout point.
Second, proce turned back down to the black trend line that forms a price channel.
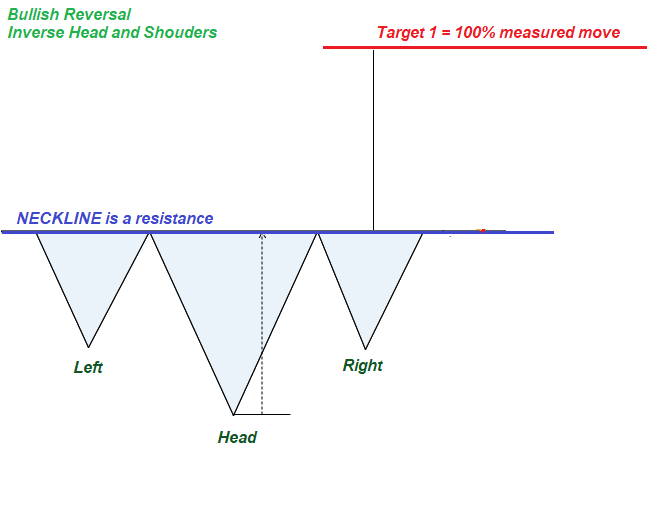
Moreover, one can argue this drop is the Right shoulder of the bullish Inverse Head andShoulders structure.
So as long as bulls hold ES over 4,376 bulls have a decent setup for another push higher to a 50% retracement at 4,460.
Alternatively, if bears manage to break under 4,376 they will activate two bearish scenarios:
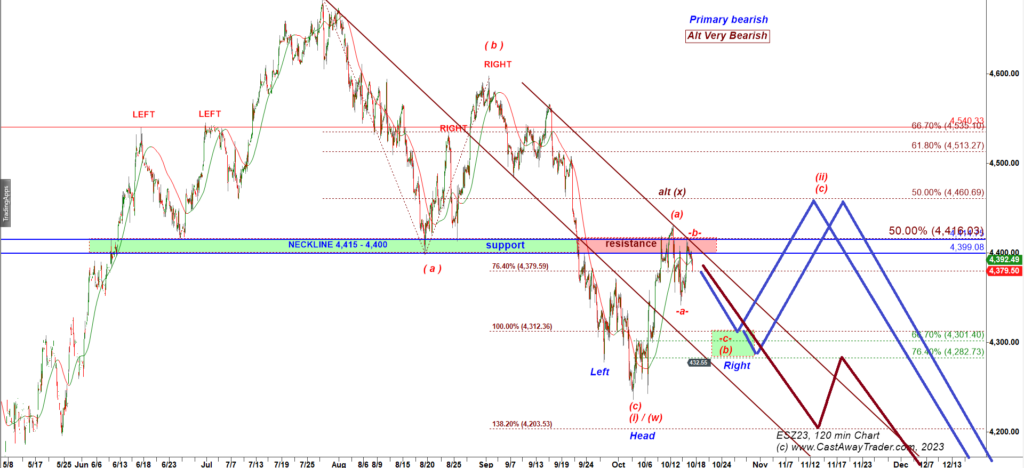
The ideal for a trader is the blue scenario. A drop into the Green Box would complete my favorite bullish reversal Inverse Head and Shoulders scenario.
The Very Bearish alt scenario: the Dark Red path: There is a chance that the October bounce was a wave (x) up that could have topped. Then price may keep going down slicing through the green box and making a new lower low of 2H 2023.
MORNING UPDATE 10-09 AM
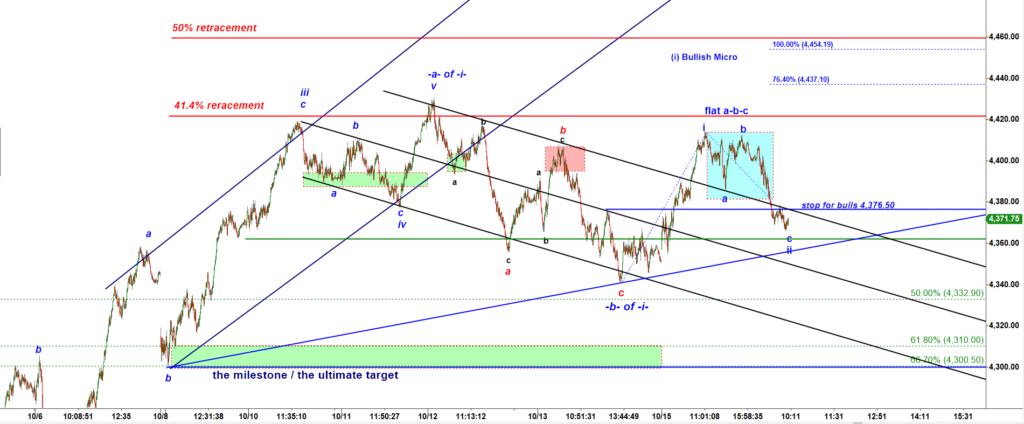
Bulls need to reclaim 4,376, the broken support to revive the bullish i up, ii down setup supported by the Inverse Head and Shoulders structure.
The pattern:
THE NOON UPDATE: (posted at 12-21 PM EST)
Here ES arrived to the target 1, the neckline of the bullish Inverse Head and Shoulders structure I shared in the morning update (see above).
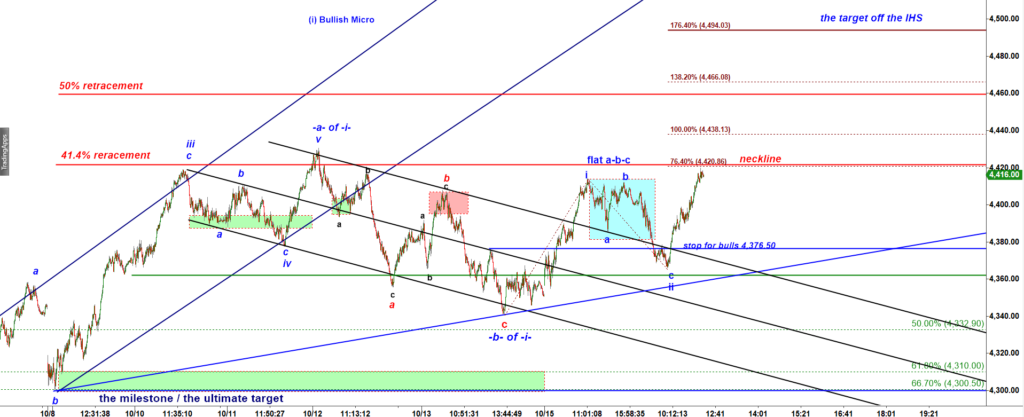
Not only that. It stopped right at the 76.4% ext of the previous push up = 4,421.
This is what I call “the risk level”.
The second leg up always faces risk of premature completion at a 76.4% ext of the first leg up.
But if bulls manage to break over 4,421 we will most likely see an acceleration of the rally with the ultimate target at 4,466 with potential extension up to 4,494.
Added at 12-45 PM
“Alternative bearish scenario”
if bulls fail at 4,421 resistance we should expect another strong drop down to the Green box: