$SPX #S&P 500 #Macro Forecast #Weekly #Elliott Wave
On Aug 21st I posted that chart with two potential macro paths:
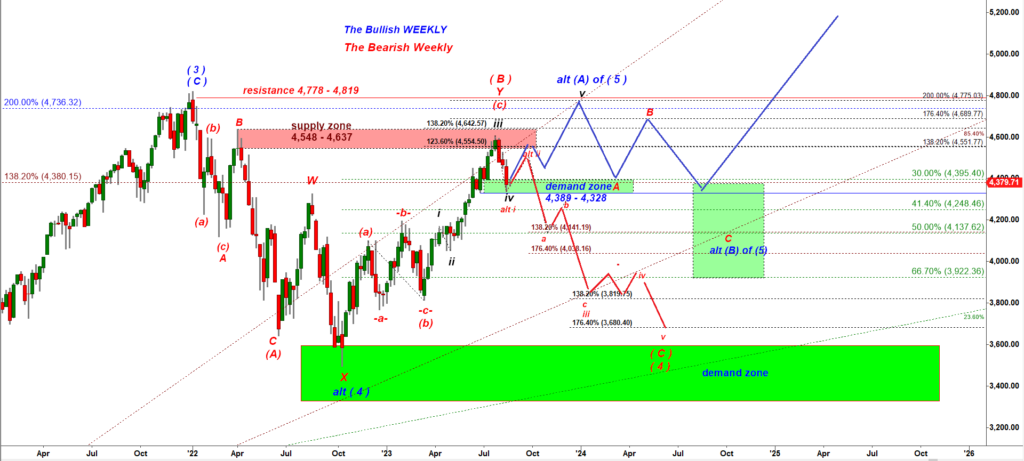
That chart demonstrates how we can handle uncertainty that is essential part of the stock market.
To be able to make money in the stock market by trying to guess what can happen next we do two things:
(i) first, we apply multi scenario analysis. We simply try to select and visualize 2 – 3 most probable scenarios, and
(ii) second, we wait for the moment when two most probable scenarios argue for a move in the same direction even though moves expected by those two scenarios may be of different magnitude.
On Aug 21st, 2023 I concluded:
“The main difference between those two paths is how strong this move up will be. SPX cash index: If this move up stops at 50% – 66.7% retracement (4,472 – 4,517) of the decline off the July top that would be the critical juncture. Note, those levels for ES-mini futures will be slightly different (4,494 – 4,541).”
So we got that move up and that move up has a clean three wave up structure. We got to the point where I expected the critical juncture. If SPX/ES keeps going higher, or we get a turn down but only get a flat a-b-c consolidation that would not fit the bearish scenario at all.
Let’s update those two macro paths:
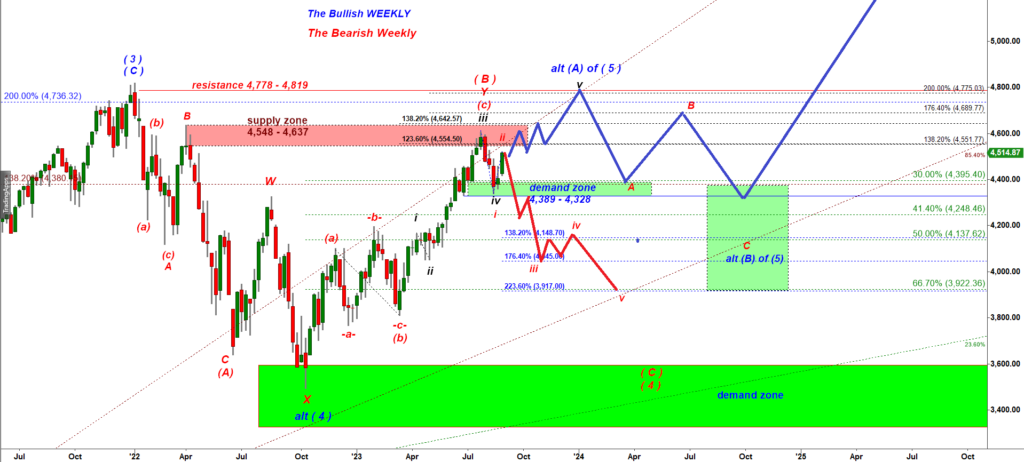
Now I will show you each of those paths on a daily timeframe in isolation:
(1) The Bearish Macro:
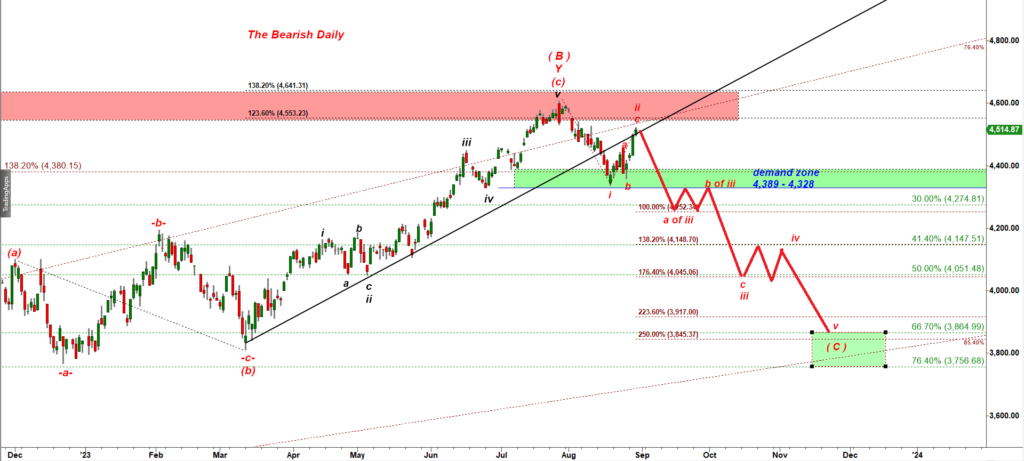
That is a crystal clear setup. I can not say I see any flaw in that wave count / scenario.
But again I have to warn you about such beautiful i down, ii up setups:
“One thing I want you to understand about that type of -i- down, -ii- up setup. The Elliott Wave followers love that type of setups because they provide enormous reward-to-risk ratio. Note that if that setup works well you can make 250 point gain just on the very first leg down in a subwave a of wave iii down. The stop loss can be places at 4,550. Therefore your risk is 35 points. So your reward-to-risk is about 7-to-1 !!!
The problem is that such high reward-to-risk type of setup has a high price tag. What I mean is that those -i- down, -ii- up setups work out well in 40-45% of cases. You will never get any Elliott Wave guru to admit that.”
Let’s now look how the (2) Bullish Macro scenario may unfold:
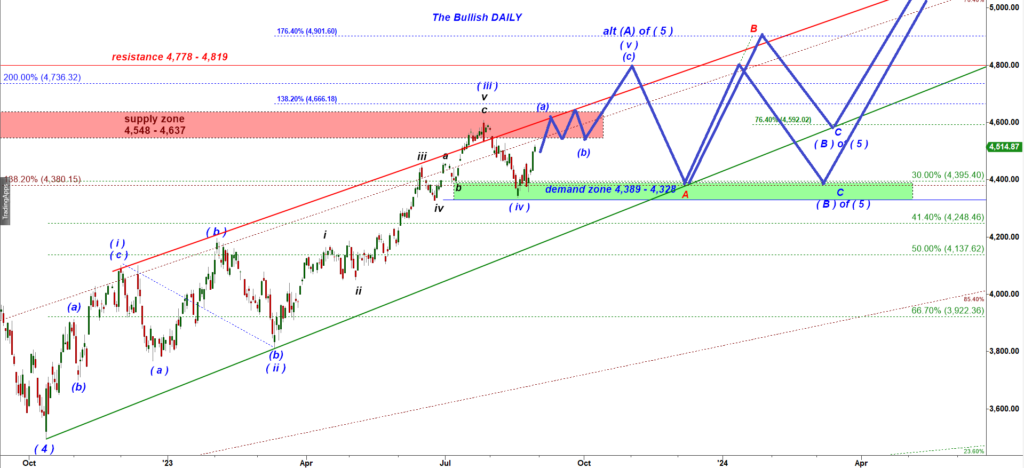
Under the bullish scenario that rally iff the mid August low has to keep pushing higher until it re-tests the late July high. The textbook pattern is that a subwave (a) f wave (v) up makes a double top re-testing the previously made high by the preceding wave (iii) up.
If we zoom-in to a 30 min chart below you can see that the bullish count requires bulls to keep pushing higher non-stop for another 50 points:
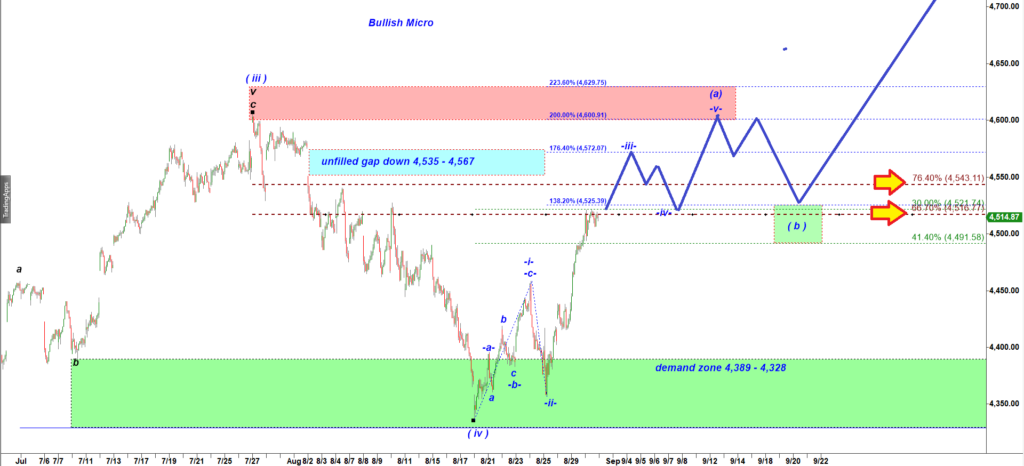
Note that S&P stopped right at the critical juncture, a 66.7% retracement of the August decline = 4,516.77.
I call that level the point of no-return for bullish pullbacks. Under a bearish count we can allow a momentarily spike over 66.7% retracement of the preceding decline but we can not tolerate any bullish flat consolidation OVER that level. Therefore, we can conclude that sustained breakout over 4,516.77 in S&P 500 index will be a strong argument in favor of the bullish scenario.