
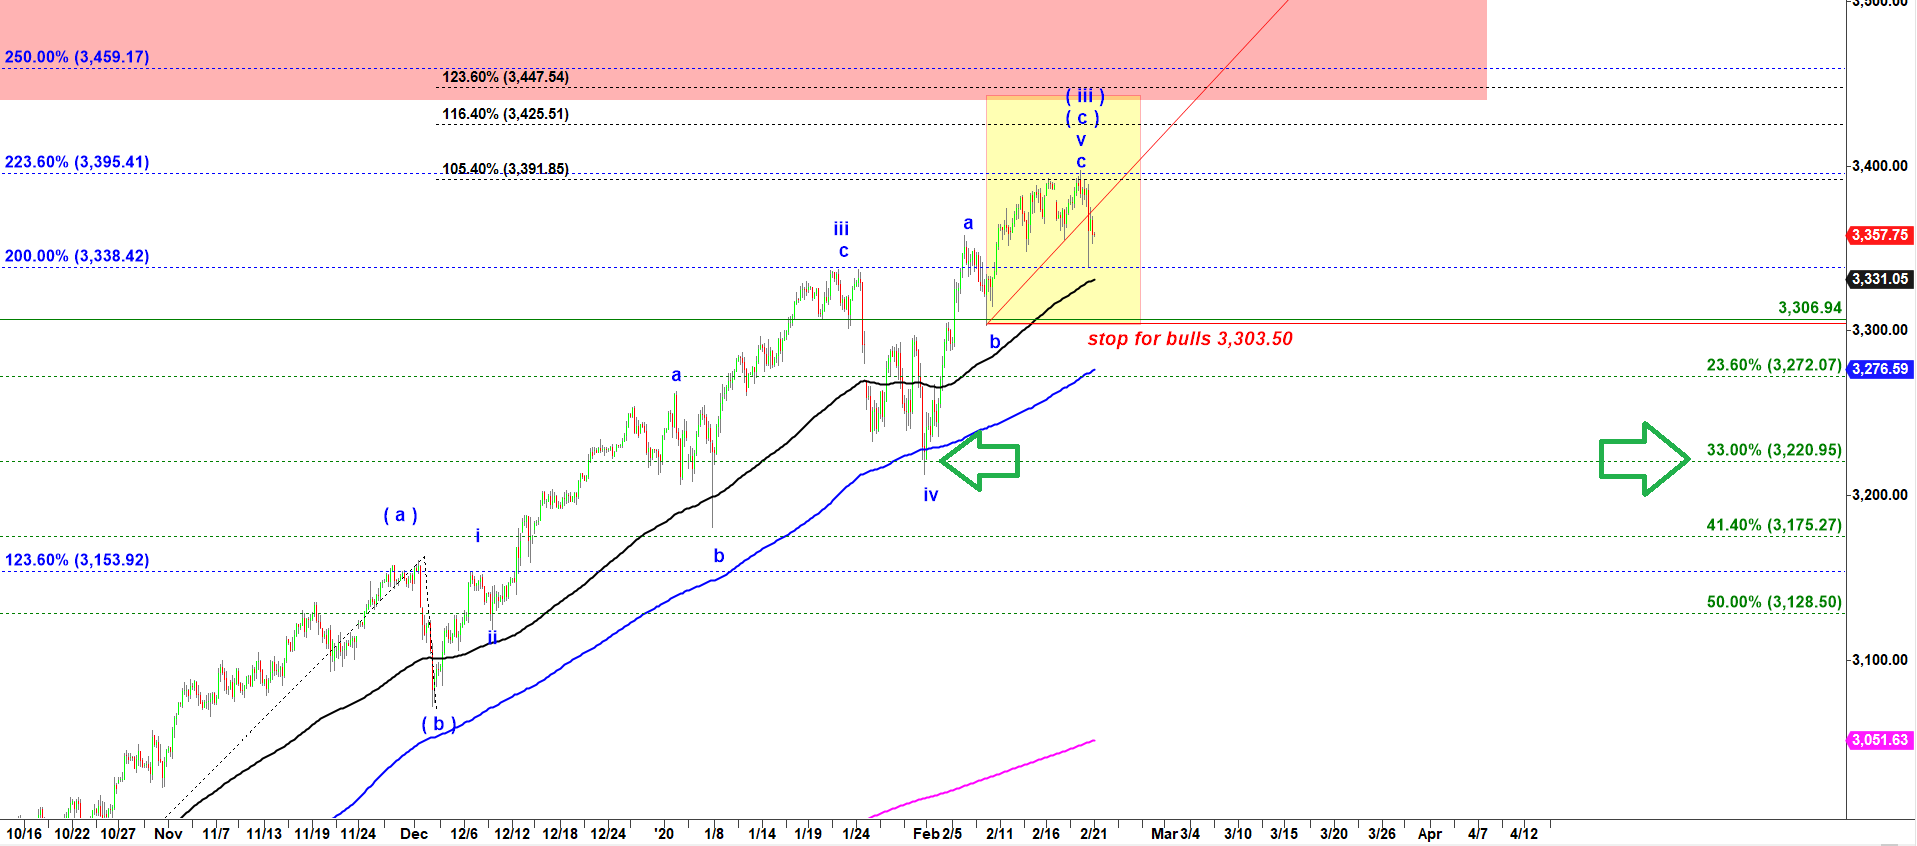
ES - the ideal target for wave ( iv ) down is 3,220
The real target for this move down in wave ( iv ) down is 3,220, the low made by wave iv down of one degree lower.
The big question is what path price will choose to follow to get there.
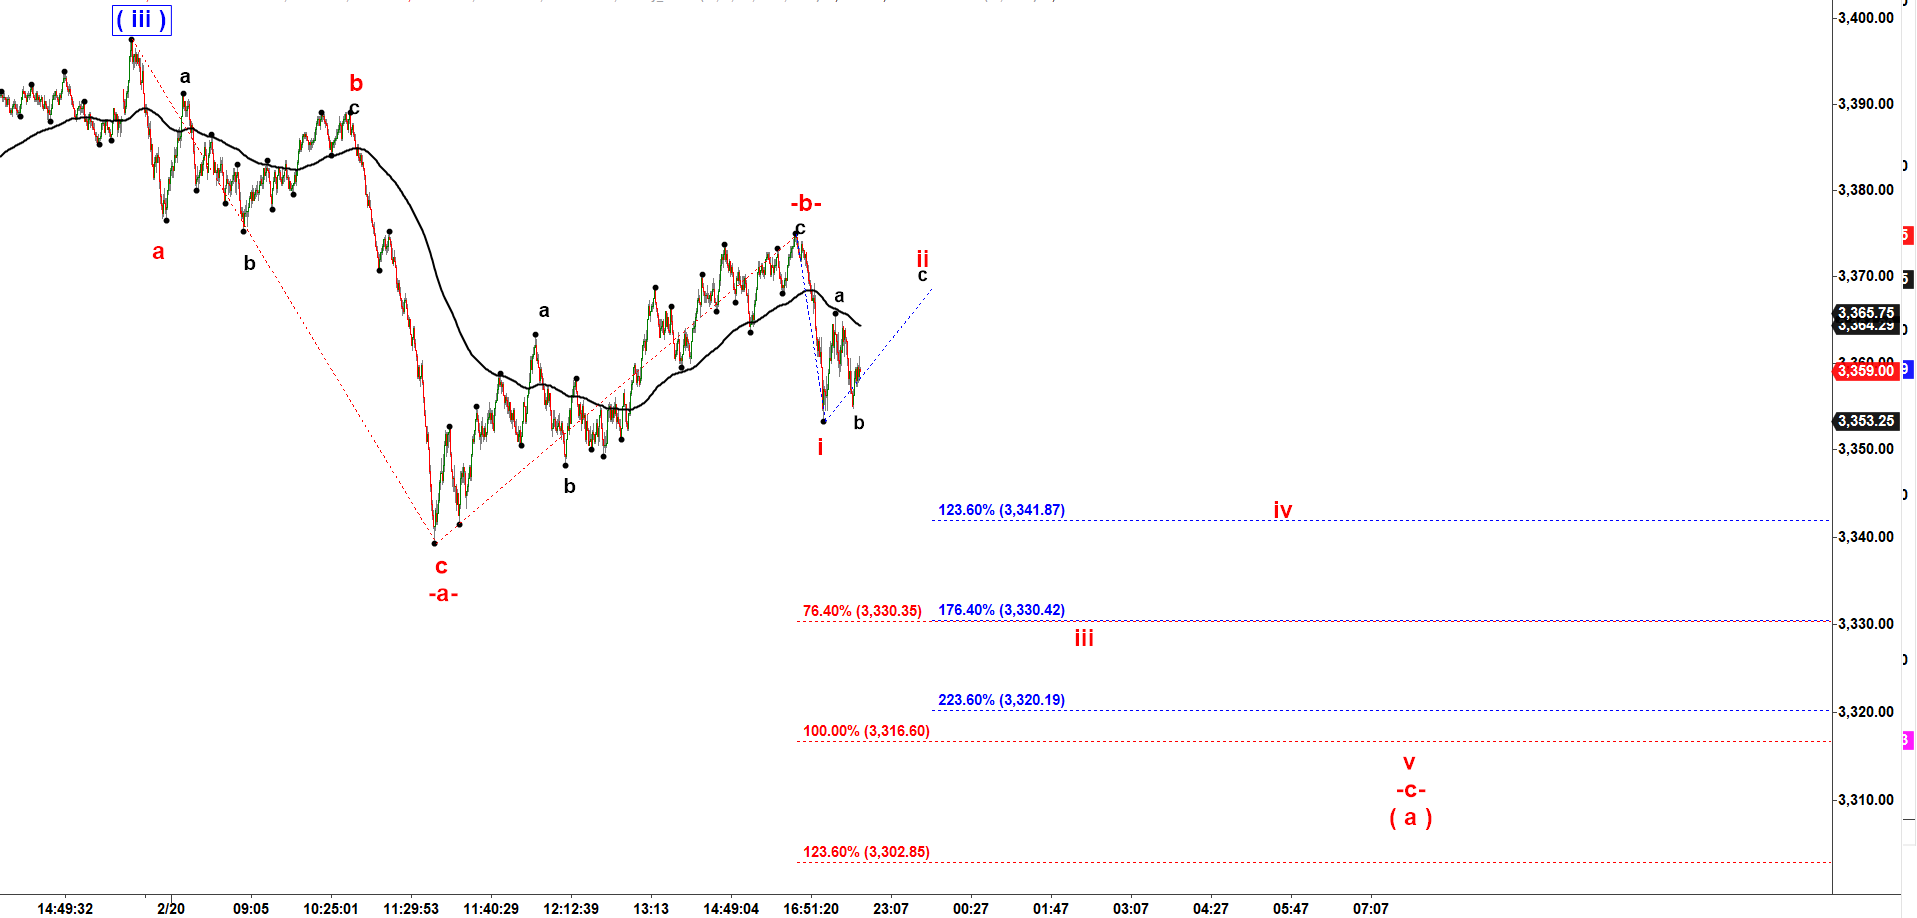
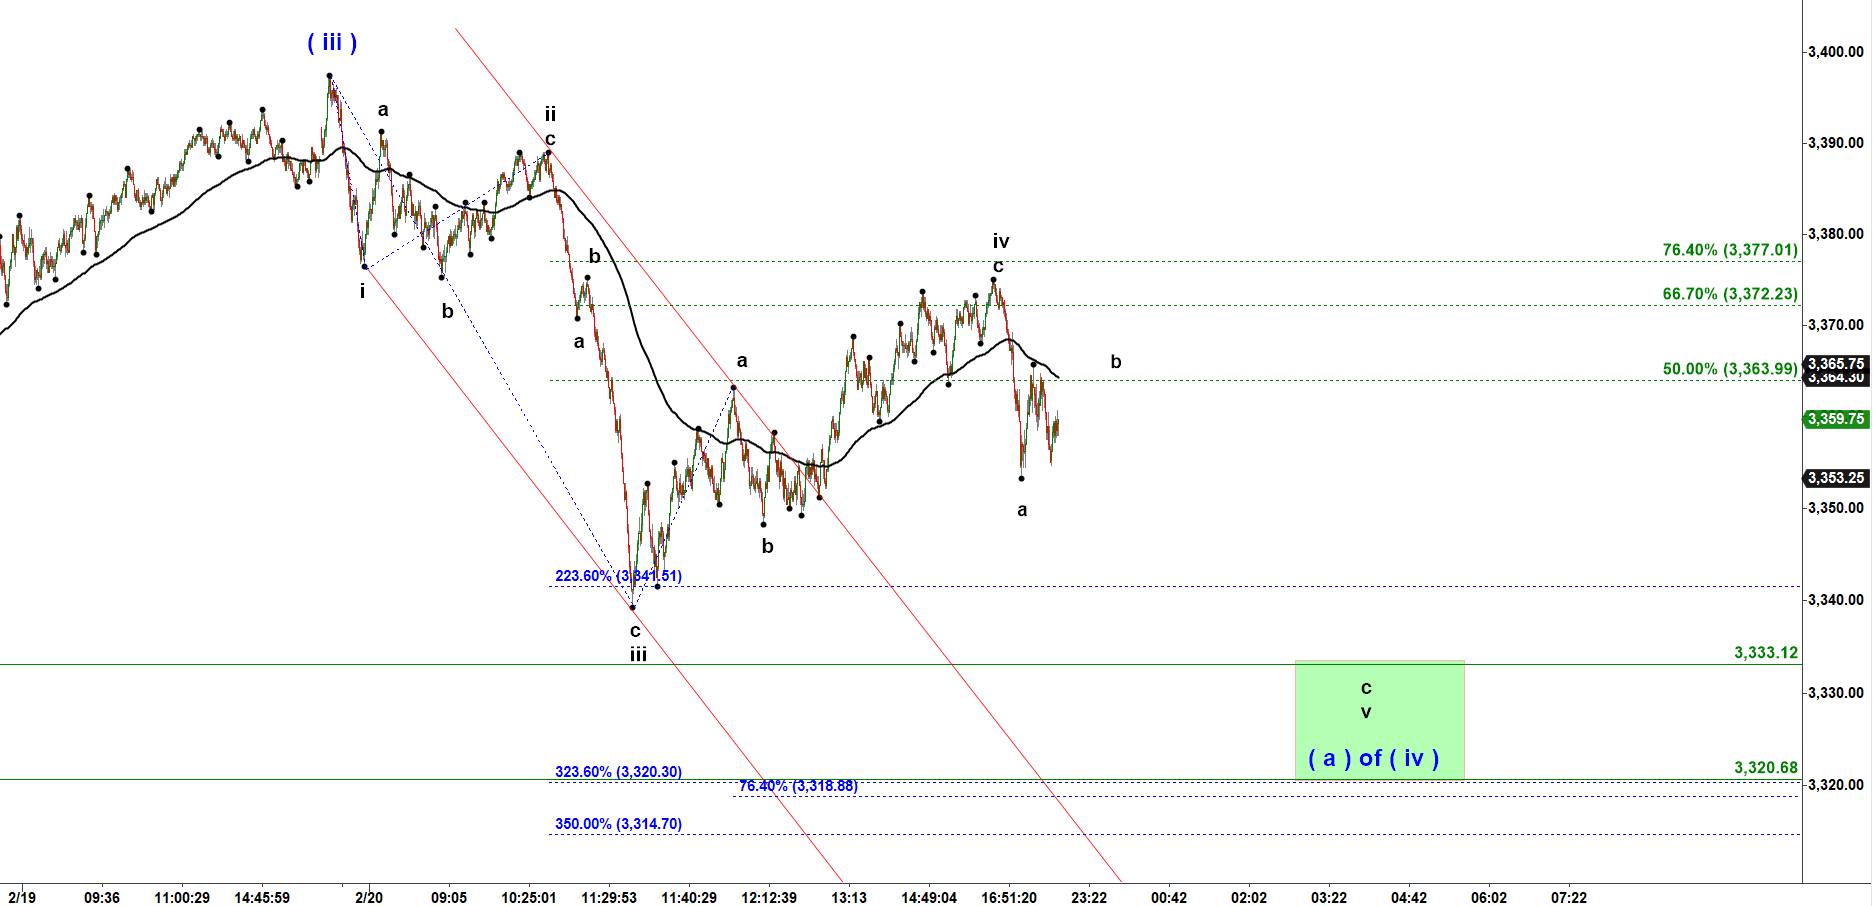
ES - 240 min chart updated at 10-30 PM on 2-20-2020
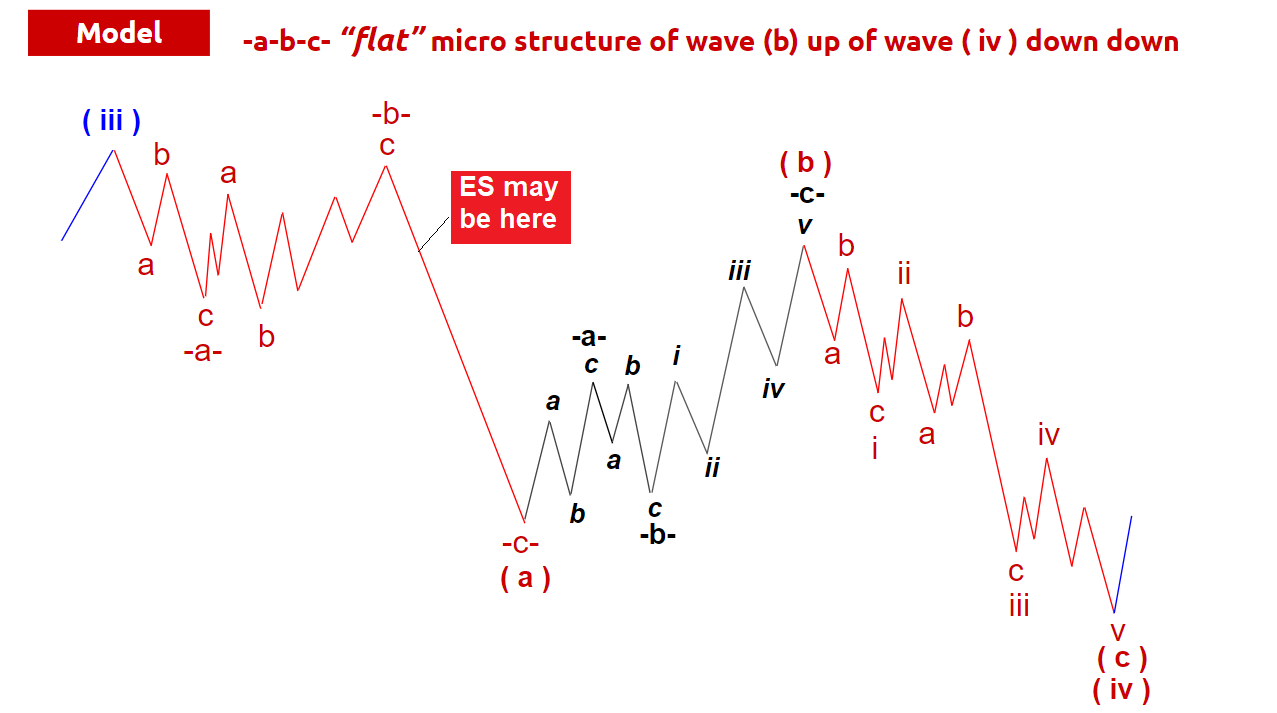
When we deal with a pullback in wave ( iv ) we have two main options: “flat” structure or “simple zig-zag” structure.
Very often teh “flat” structure is also called “3-3-5” corrective structure:
“3” stands for three waves down check red a-b-c;
“3” stands for three waves up check black a-b-c;
“5” stands for the final subwave c should always have an impulsive structure i-ii-iii-iv-v.
This is how a model of that corrective structure looks like:
This is how ES can follow the path proposed by the “flat” corrective structure:
ES - 1,500 tick bar chart updated at 10-37 Pm on 2-20-2020
Another alternative corrective structure is “Simple Zig Zag”. It is often called “5-3-5” structure.
In this case the first leg down in subwave ( a ) of ( iv ) has an “impulsive” structure.
It is subdivided into five waves labelled as i, ii, iii, iv and v.
When the first leg down has five micro waves we call that structure the “Simple Zig Zag”.
That type of a structure is normally the deepest and fastest form of corrective wave.
Because both legs have “impulsive” structure, they are strong drops.
And, in contrast, the corrective subwave ( b ) up would not go much higher than 50-61.8% retracement of wave ( a ) down.
It can be as shallow as 33.3% or 41.4%.
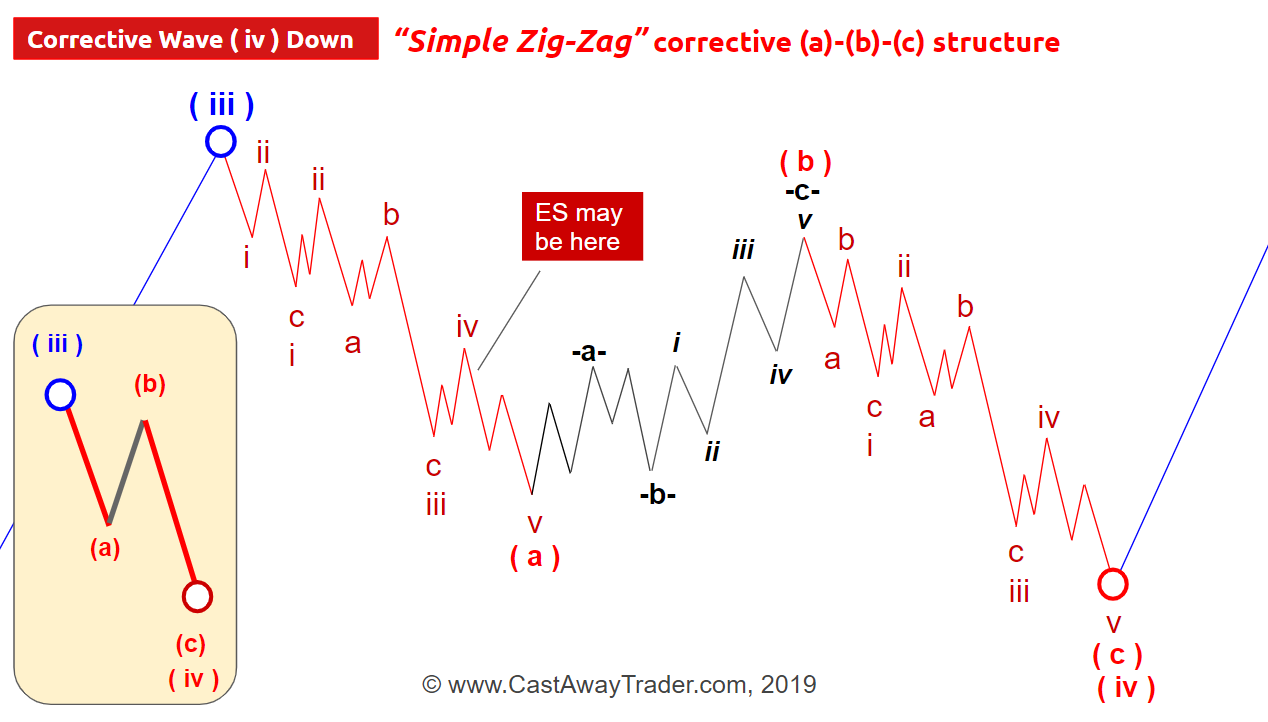
This is how ES can follow the path proposed by the “simple zig-zag” corrective structure:
ES - 1,500 tick bar chart updated at 10-37 Pm on 2-20-2020
Trading is risky. Read this important Disclaimer
HIGH RISK WARNING
Trading stocks, options, or futures carries a high level of risk, and may not be suitable for all investors. Before deciding to trade, you should carefully consider your objectives, financial situation, needs and level of experience. CastAway Trader LLC provides general overview of trading methods that does not take into account your objectives, financial situation or needs. The content of this website must not be construed as personal advice. The possibility exists that you could sustain a loss in excess of your deposited funds and therefore, you should not speculate with capital that you cannot afford to lose. You should be aware of all the risks associated with trading. You should seek advice from an independent financial advisor. Past performance is not necessarily indicative of future success.