
S&P cash index: Macro Analysis
Last week we got a super strong one week advance in S&P right into 21 EMA weekly line.
EMA 21 on weekly chart is a borderline in between of a bull and a bear markets.
We can identify two macro counts, a Bearish and a Bullish scenario.
In that update I will describe the Bearish SPX Weekly which I personally prefer.
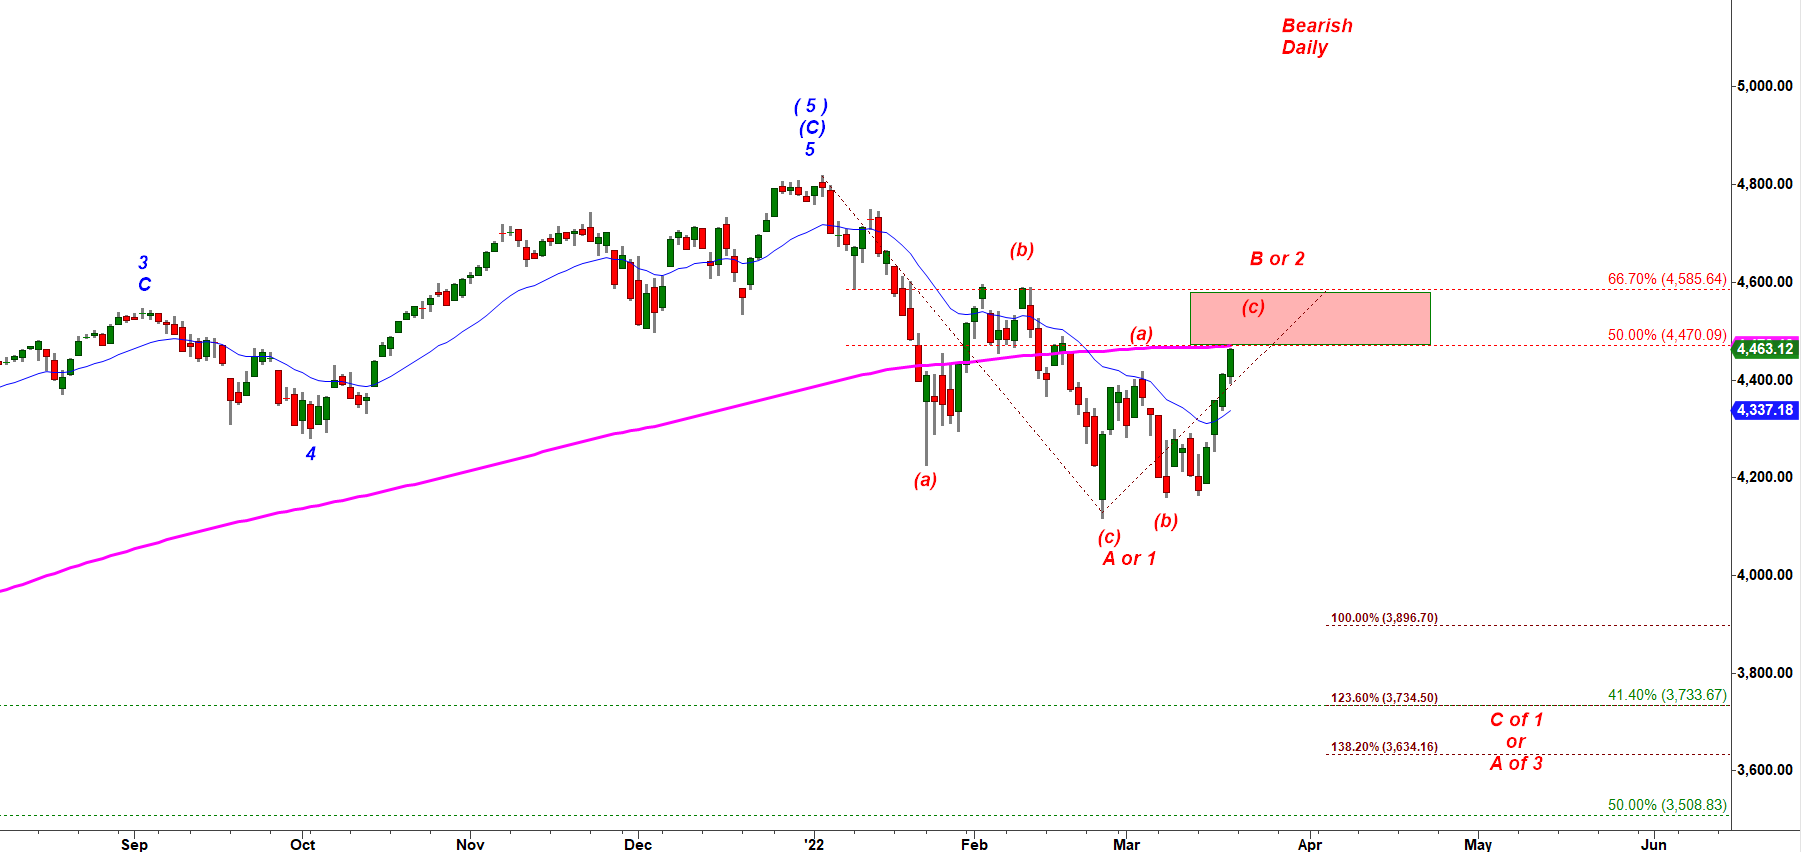
Under the Bearish count shown below S&P Made a lasting top in Jan 2022 and has been working on the very first A-B-C move down that can also be counted as a bearish 1 down, 2 up setup
S&P - weekly chart updated as of Friday, March 20th close

This is how that count looks on a daily chart (see below).
S&P - daily chart updated as of Friday, March 20th close
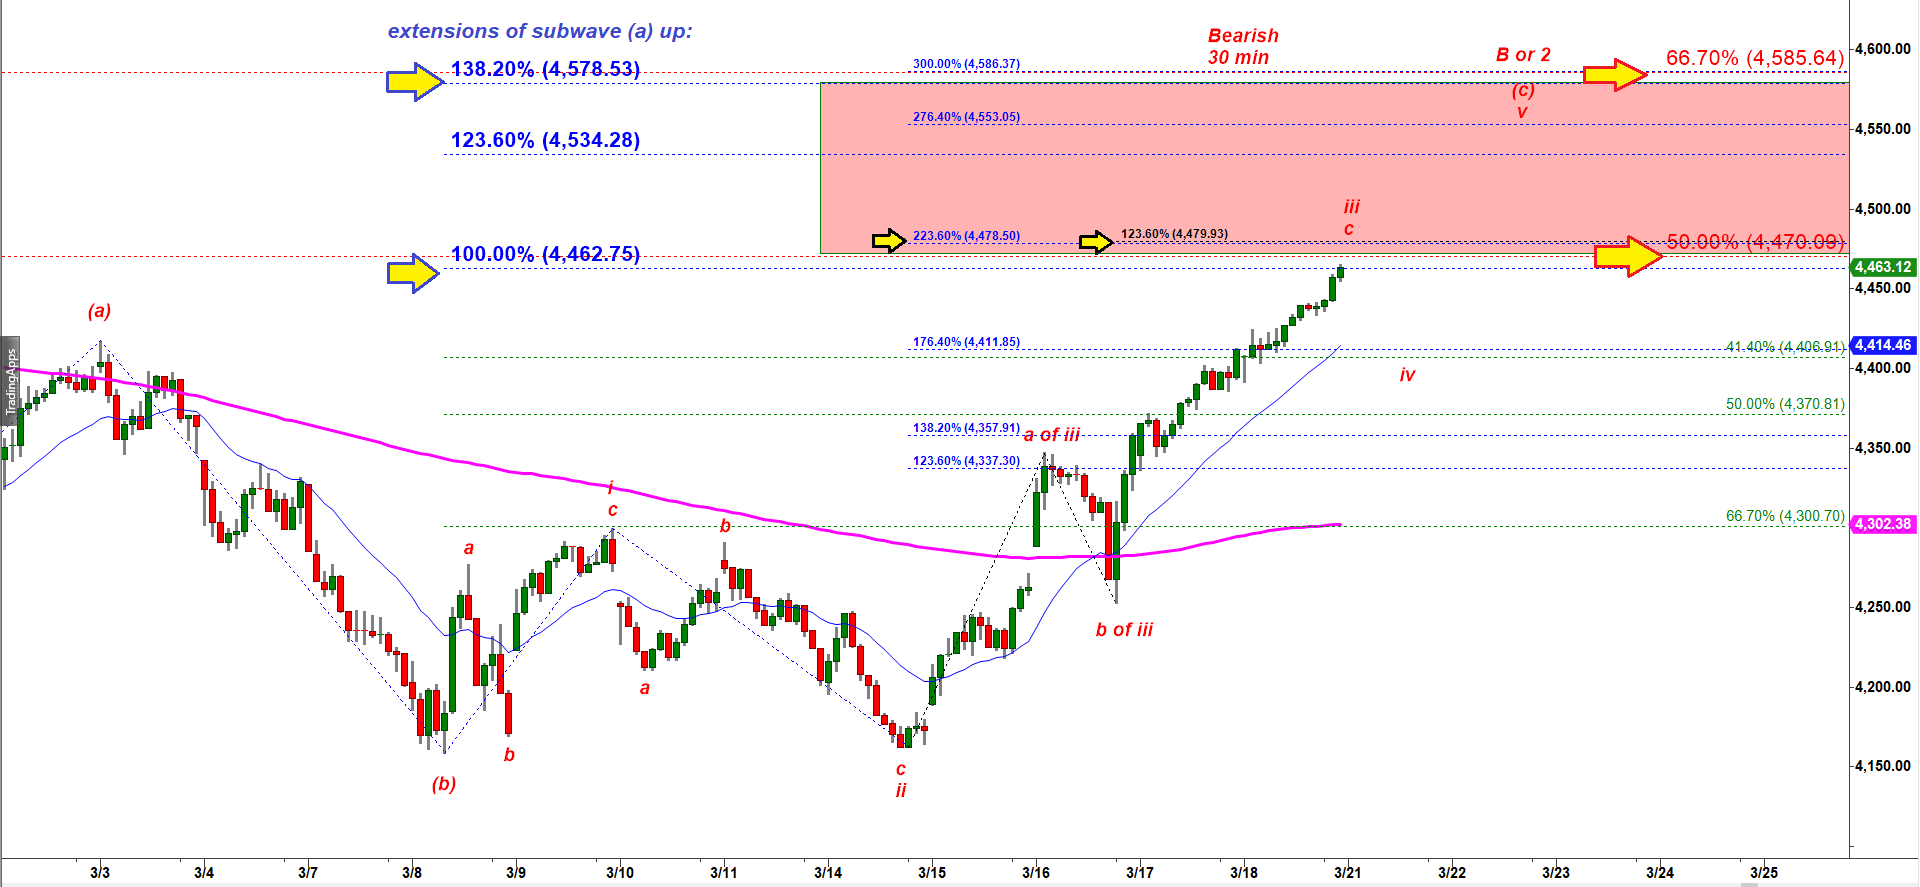
Now let’s zoom-in to 30 min chart shown below.
On Friday S&P hit an important 100% ext of subwave (a) up.
On a daily chart shown above you can see that wave B up had a clean (a)-(b)-(c) up structure.
On 30 min chart we are studying a micro structure of the second leg up in subwave (c) up.
The relentless move up on Friday looked like subwave c of wave iii of (c).
It can stretch higher to 4,470 – 4,478 which is a confluence of
– 223.6% ext of wave i up ( a typical target for subwave c of wave iii up), and
– 50% retracement of the whole (a)-(b)-(c) down decline off the Jan’2022 top.
That cluster of fibs is a very strong resistance. That rally in subwave (c) of wave B up may stop at that level.
If we get a corrective a-b-c down structure to 4,306 – 4,370 that would be a micro wave iv down that can be used by bulls as a base for another rally in wave v up targeting 4,580, another strong confluence of fibs:
– 300% ext of wave i up ( a typical target for wave v up if wave iii topped at 223.6% ext, and – 66.7% retracement of the whole (a)-(b)-(c) down decline off the Jan’2022 top, and
– 138.2% ext of subwave (a) up.
Break under 4,370 would be a serious warning for bulls saying that the whole (a)-(b)-(c) up structure of wave B up has topped and wave v up to a higher high would not come. Upon completion of the (a)-(b)-(c) up structure of wave B up I expect another large decline in leg C down targeting 3,800.
S&P - 30 min chart updated as of Friday, March 20th close
Previous Updates:
Important Disclaimer
CastAway Trader LLC, the publisher of this web-site and videos is not registered as an investment adviser nor a broker/dealer with either the U. S. Securities & Exchange Commission or any state securities regulatory authority. Users of the website www.castawaytrader.com and viewers of the videos are advised that all information presented on the website is solely for informational purposes, is not intended to be used as a personalized investment recommendation, and is not attuned to any specific portfolio or to any user’s particular investment needs or objectives.
Trading stocks, options, or futures carries a high level of risk, and may not be suitable for all investors. Before deciding to trade, you should carefully consider your objectives, financial situation, needs and level of experience. CastAway Trader LLC provides general overview of trading methods that does not take into account your objectives, financial situation or needs. The content of this website must not be construed as personal advice. All trading setups and/or trades presented in the web site and/or trading chat room by CastAway Trader an/or by other members of the chat should be considered hypothetical for educational purposes only and should not be expected to be replicated in a live trading account.
An investor could potentially lose all or more than the initial investment. You should not speculate with capital that you cannot afford to lose. Only risk capital should be used for trading and only those with sufficient risk capital should consider trading. Risk capital is money that can be lost without jeopardizing ones’ financial security or life style.
You should be aware of all the risks associated with trading. You should seek advice from an independent financial advisor.
Any information posted on this web site is not to be construed as an offer to sell or the solicitation of an offer to buy, nor is it to be construed as a recommendation to buy, hold or sell (short or otherwise) any security. All users of the website must determine for themselves what specific investments to make or not make and are urged to consult with their own independent financial advisors with respect to any investment decision. The reader bears responsibility for his/her own investment research and decisions, should seek the advice of a qualified securities professional before making any investment, and investigate and fully understand any and all risks before investing. All opinions, analyses and information posted on the website are based on sources believed to be reliable and written in good faith, but should be independently verified, and no representation or warranty of any kind, express or implied, is made, including but not limited to any representation or warranty concerning accuracy, completeness, correctness, timeliness or appropriateness. In addition, CastAwayTrader LLC and its officers and employees undertake no responsibility to notify such opinions, analyses or information or to keep such opinions, analyses or information current. Also be aware that the owners, officers and employees of the web site www.castawaytrader.com may have long or short positions in securities that may be discussed on the website, Premium Trading Chat room and/or in the videos posted by CastAway Trader LLC.
Past results are not indicative of future profits.